Sri Lankan vs Kiowa Child Poverty Among Boys Under 16
COMPARE
Sri Lankan
Kiowa
Child Poverty Among Boys Under 16
Child Poverty Among Boys Under 16 Comparison
Sri Lankans
Kiowa
14.9%
CHILD POVERTY AMONG BOYS UNDER 16
96.7/ 100
METRIC RATING
93rd/ 347
METRIC RANK
21.3%
CHILD POVERTY AMONG BOYS UNDER 16
0.0/ 100
METRIC RATING
305th/ 347
METRIC RANK
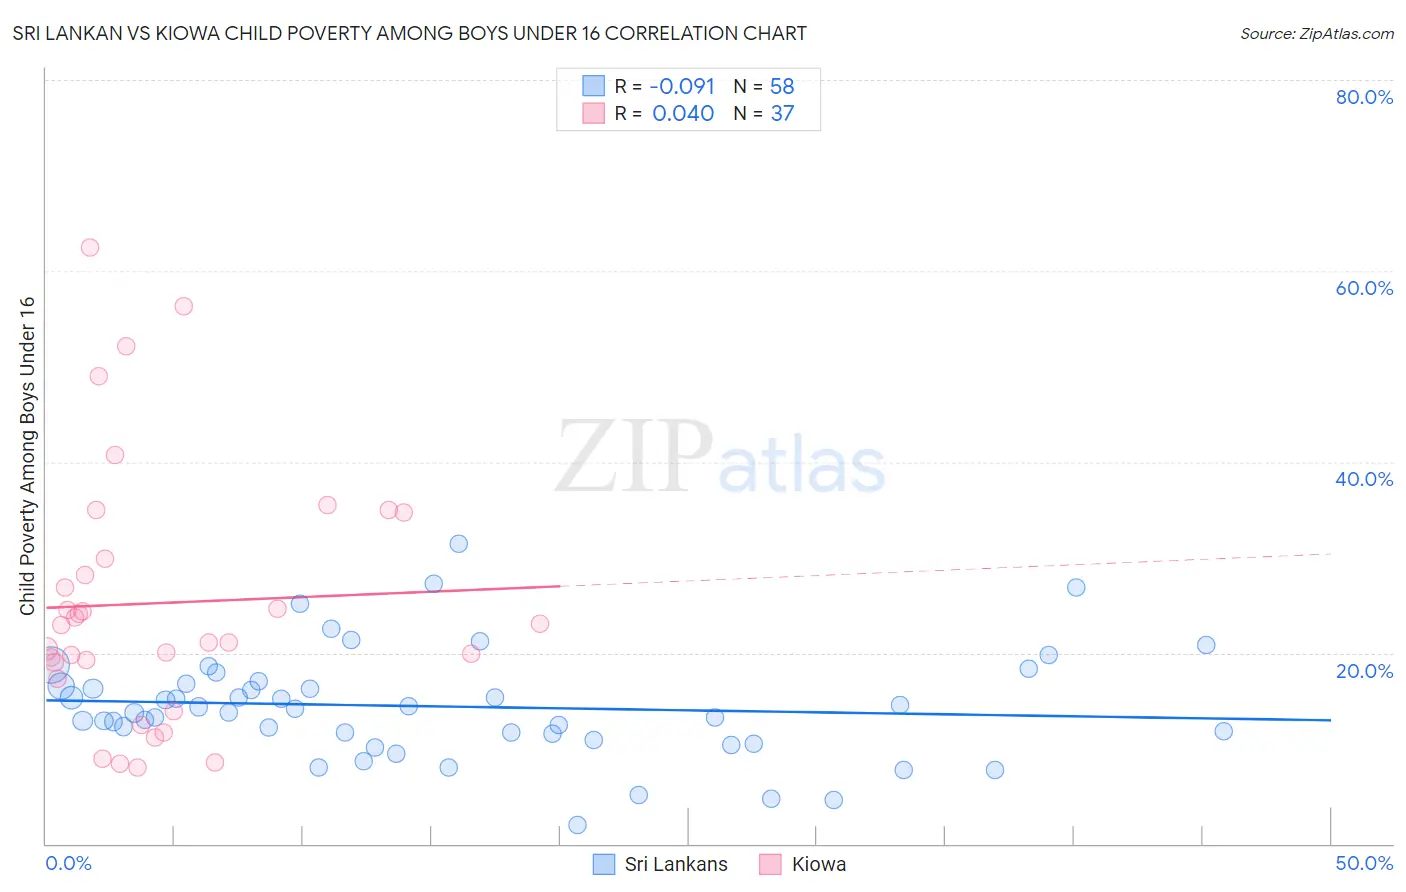
Sri Lankan vs Kiowa Child Poverty Among Boys Under 16 Correlation Chart
The statistical analysis conducted on geographies consisting of 433,188,416 people shows a slight negative correlation between the proportion of Sri Lankans and poverty level among boys under the age of 16 in the United States with a correlation coefficient (R) of -0.091 and weighted average of 14.9%. Similarly, the statistical analysis conducted on geographies consisting of 55,969,727 people shows no correlation between the proportion of Kiowa and poverty level among boys under the age of 16 in the United States with a correlation coefficient (R) of 0.040 and weighted average of 21.3%, a difference of 43.1%.
Child Poverty Among Boys Under 16 Correlation Summary
| Measurement | Sri Lankan | Kiowa |
| Minimum | 2.0% | 8.0% |
| Maximum | 31.4% | 62.5% |
| Range | 29.4% | 54.5% |
| Mean | 14.4% | 25.2% |
| Median | 14.0% | 22.9% |
| Interquartile 25% (IQ1) | 11.6% | 18.1% |
| Interquartile 75% (IQ3) | 16.8% | 32.3% |
| Interquartile Range (IQR) | 5.3% | 14.2% |
| Standard Deviation (Sample) | 5.7% | 13.4% |
| Standard Deviation (Population) | 5.6% | 13.2% |
Similar Demographics by Child Poverty Among Boys Under 16
Demographics Similar to Sri Lankans by Child Poverty Among Boys Under 16
In terms of child poverty among boys under 16, the demographic groups most similar to Sri Lankans are Immigrants from Italy (14.9%, a difference of 0.0%), Argentinean (14.9%, a difference of 0.050%), Finnish (14.9%, a difference of 0.11%), Paraguayan (14.9%, a difference of 0.13%), and Immigrants from North Macedonia (14.9%, a difference of 0.36%).
| Demographics | Rating | Rank | Child Poverty Among Boys Under 16 |
| Germans | 97.2 /100 | #86 | Exceptional 14.8% |
| Northern Europeans | 97.2 /100 | #87 | Exceptional 14.8% |
| Immigrants | North America | 97.1 /100 | #88 | Exceptional 14.8% |
| Immigrants | Argentina | 97.1 /100 | #89 | Exceptional 14.8% |
| Austrians | 97.1 /100 | #90 | Exceptional 14.8% |
| Paraguayans | 96.8 /100 | #91 | Exceptional 14.9% |
| Argentineans | 96.7 /100 | #92 | Exceptional 14.9% |
| Sri Lankans | 96.7 /100 | #93 | Exceptional 14.9% |
| Immigrants | Italy | 96.7 /100 | #94 | Exceptional 14.9% |
| Finns | 96.5 /100 | #95 | Exceptional 14.9% |
| Immigrants | North Macedonia | 96.3 /100 | #96 | Exceptional 14.9% |
| Immigrants | Egypt | 96.2 /100 | #97 | Exceptional 14.9% |
| British | 96.2 /100 | #98 | Exceptional 15.0% |
| Immigrants | France | 96.1 /100 | #99 | Exceptional 15.0% |
| Chileans | 95.8 /100 | #100 | Exceptional 15.0% |
Demographics Similar to Kiowa by Child Poverty Among Boys Under 16
In terms of child poverty among boys under 16, the demographic groups most similar to Kiowa are Immigrants from Grenada (21.3%, a difference of 0.010%), Choctaw (21.3%, a difference of 0.10%), Immigrants from Central America (21.3%, a difference of 0.17%), Immigrants from Haiti (21.3%, a difference of 0.23%), and Somali (21.1%, a difference of 0.76%).
| Demographics | Rating | Rank | Child Poverty Among Boys Under 16 |
| Chippewa | 0.0 /100 | #298 | Tragic 21.0% |
| Immigrants | Caribbean | 0.0 /100 | #299 | Tragic 21.0% |
| Haitians | 0.0 /100 | #300 | Tragic 21.0% |
| Guatemalans | 0.0 /100 | #301 | Tragic 21.1% |
| Somalis | 0.0 /100 | #302 | Tragic 21.1% |
| Immigrants | Haiti | 0.0 /100 | #303 | Tragic 21.3% |
| Immigrants | Central America | 0.0 /100 | #304 | Tragic 21.3% |
| Kiowa | 0.0 /100 | #305 | Tragic 21.3% |
| Immigrants | Grenada | 0.0 /100 | #306 | Tragic 21.3% |
| Choctaw | 0.0 /100 | #307 | Tragic 21.3% |
| Immigrants | Mexico | 0.0 /100 | #308 | Tragic 21.5% |
| Seminole | 0.0 /100 | #309 | Tragic 21.5% |
| Creek | 0.0 /100 | #310 | Tragic 21.5% |
| Bahamians | 0.0 /100 | #311 | Tragic 21.6% |
| Immigrants | Guatemala | 0.0 /100 | #312 | Tragic 21.6% |