Sri Lankan vs Jamaican Female Poverty Among 25-34 Year Olds
COMPARE
Sri Lankan
Jamaican
Female Poverty Among 25-34 Year Olds
Female Poverty Among 25-34 Year Olds Comparison
Sri Lankans
Jamaicans
12.2%
FEMALE POVERTY AMONG 25-34 YEAR OLDS
99.1/ 100
METRIC RATING
68th/ 347
METRIC RANK
14.8%
FEMALE POVERTY AMONG 25-34 YEAR OLDS
1.0/ 100
METRIC RATING
246th/ 347
METRIC RANK
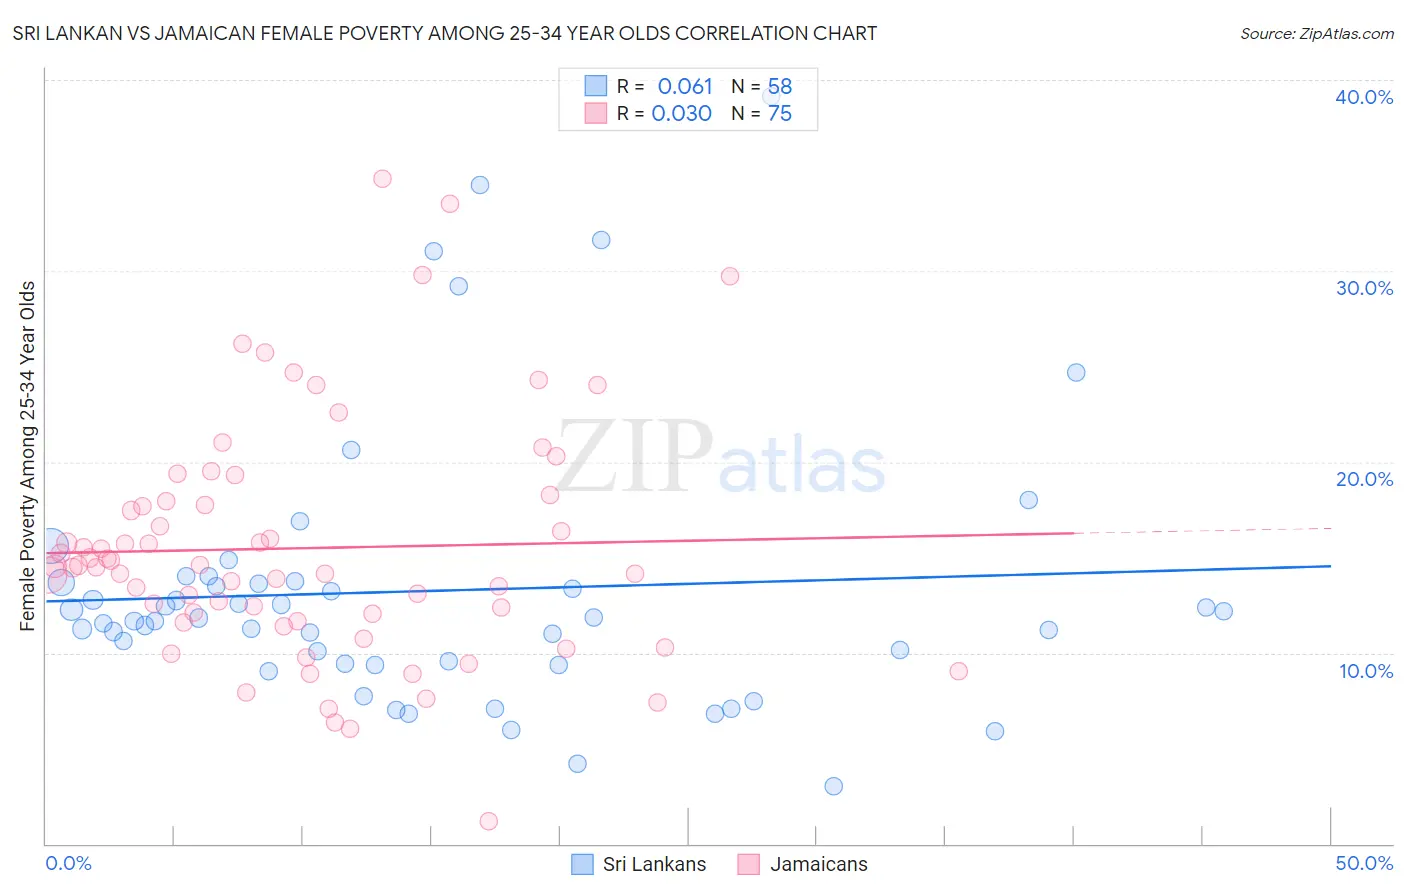
Sri Lankan vs Jamaican Female Poverty Among 25-34 Year Olds Correlation Chart
The statistical analysis conducted on geographies consisting of 433,227,670 people shows a slight positive correlation between the proportion of Sri Lankans and poverty level among females between the ages 25 and 34 in the United States with a correlation coefficient (R) of 0.061 and weighted average of 12.2%. Similarly, the statistical analysis conducted on geographies consisting of 363,151,560 people shows no correlation between the proportion of Jamaicans and poverty level among females between the ages 25 and 34 in the United States with a correlation coefficient (R) of 0.030 and weighted average of 14.8%, a difference of 21.4%.
Female Poverty Among 25-34 Year Olds Correlation Summary
| Measurement | Sri Lankan | Jamaican |
| Minimum | 3.0% | 1.1% |
| Maximum | 39.1% | 34.8% |
| Range | 36.1% | 33.7% |
| Mean | 13.2% | 15.5% |
| Median | 11.8% | 14.5% |
| Interquartile 25% (IQ1) | 9.4% | 11.6% |
| Interquartile 75% (IQ3) | 13.7% | 17.9% |
| Interquartile Range (IQR) | 4.2% | 6.3% |
| Standard Deviation (Sample) | 7.2% | 6.3% |
| Standard Deviation (Population) | 7.2% | 6.2% |
Similar Demographics by Female Poverty Among 25-34 Year Olds
Demographics Similar to Sri Lankans by Female Poverty Among 25-34 Year Olds
In terms of female poverty among 25-34 year olds, the demographic groups most similar to Sri Lankans are Immigrants from Lebanon (12.2%, a difference of 0.030%), Immigrants from Belgium (12.2%, a difference of 0.060%), Immigrants from Scotland (12.2%, a difference of 0.070%), Lithuanian (12.2%, a difference of 0.12%), and Laotian (12.2%, a difference of 0.21%).
| Demographics | Rating | Rank | Female Poverty Among 25-34 Year Olds |
| Immigrants | Czechoslovakia | 99.4 /100 | #61 | Exceptional 12.1% |
| Immigrants | Moldova | 99.3 /100 | #62 | Exceptional 12.1% |
| Soviet Union | 99.3 /100 | #63 | Exceptional 12.1% |
| Immigrants | Russia | 99.2 /100 | #64 | Exceptional 12.2% |
| Armenians | 99.2 /100 | #65 | Exceptional 12.2% |
| Immigrants | Europe | 99.2 /100 | #66 | Exceptional 12.2% |
| Laotians | 99.2 /100 | #67 | Exceptional 12.2% |
| Sri Lankans | 99.1 /100 | #68 | Exceptional 12.2% |
| Immigrants | Lebanon | 99.1 /100 | #69 | Exceptional 12.2% |
| Immigrants | Belgium | 99.1 /100 | #70 | Exceptional 12.2% |
| Immigrants | Scotland | 99.1 /100 | #71 | Exceptional 12.2% |
| Lithuanians | 99.1 /100 | #72 | Exceptional 12.2% |
| Immigrants | Vietnam | 98.9 /100 | #73 | Exceptional 12.3% |
| Immigrants | Sweden | 98.9 /100 | #74 | Exceptional 12.3% |
| Estonians | 98.9 /100 | #75 | Exceptional 12.3% |
Demographics Similar to Jamaicans by Female Poverty Among 25-34 Year Olds
In terms of female poverty among 25-34 year olds, the demographic groups most similar to Jamaicans are Immigrants from Middle Africa (14.8%, a difference of 0.040%), Immigrants from Nicaragua (14.8%, a difference of 0.22%), Immigrants from Bangladesh (14.8%, a difference of 0.22%), Scotch-Irish (14.8%, a difference of 0.26%), and Barbadian (14.8%, a difference of 0.26%).
| Demographics | Rating | Rank | Female Poverty Among 25-34 Year Olds |
| Malaysians | 1.4 /100 | #239 | Tragic 14.7% |
| Immigrants | Grenada | 1.3 /100 | #240 | Tragic 14.7% |
| Scotch-Irish | 1.2 /100 | #241 | Tragic 14.8% |
| Barbadians | 1.2 /100 | #242 | Tragic 14.8% |
| Immigrants | Nicaragua | 1.1 /100 | #243 | Tragic 14.8% |
| Immigrants | Bangladesh | 1.1 /100 | #244 | Tragic 14.8% |
| Immigrants | Middle Africa | 1.0 /100 | #245 | Tragic 14.8% |
| Jamaicans | 1.0 /100 | #246 | Tragic 14.8% |
| German Russians | 0.8 /100 | #247 | Tragic 14.9% |
| Immigrants | Western Africa | 0.8 /100 | #248 | Tragic 14.9% |
| Immigrants | Haiti | 0.5 /100 | #249 | Tragic 15.0% |
| Immigrants | El Salvador | 0.5 /100 | #250 | Tragic 15.0% |
| Haitians | 0.5 /100 | #251 | Tragic 15.0% |
| Belizeans | 0.4 /100 | #252 | Tragic 15.1% |
| Immigrants | West Indies | 0.4 /100 | #253 | Tragic 15.1% |