Sri Lankan vs Immigrants from Asia Female Poverty
COMPARE
Sri Lankan
Immigrants from Asia
Female Poverty
Female Poverty Comparison
Sri Lankans
Immigrants from Asia
12.7%
FEMALE POVERTY
90.9/ 100
METRIC RATING
118th/ 347
METRIC RANK
12.2%
FEMALE POVERTY
98.1/ 100
METRIC RATING
61st/ 347
METRIC RANK
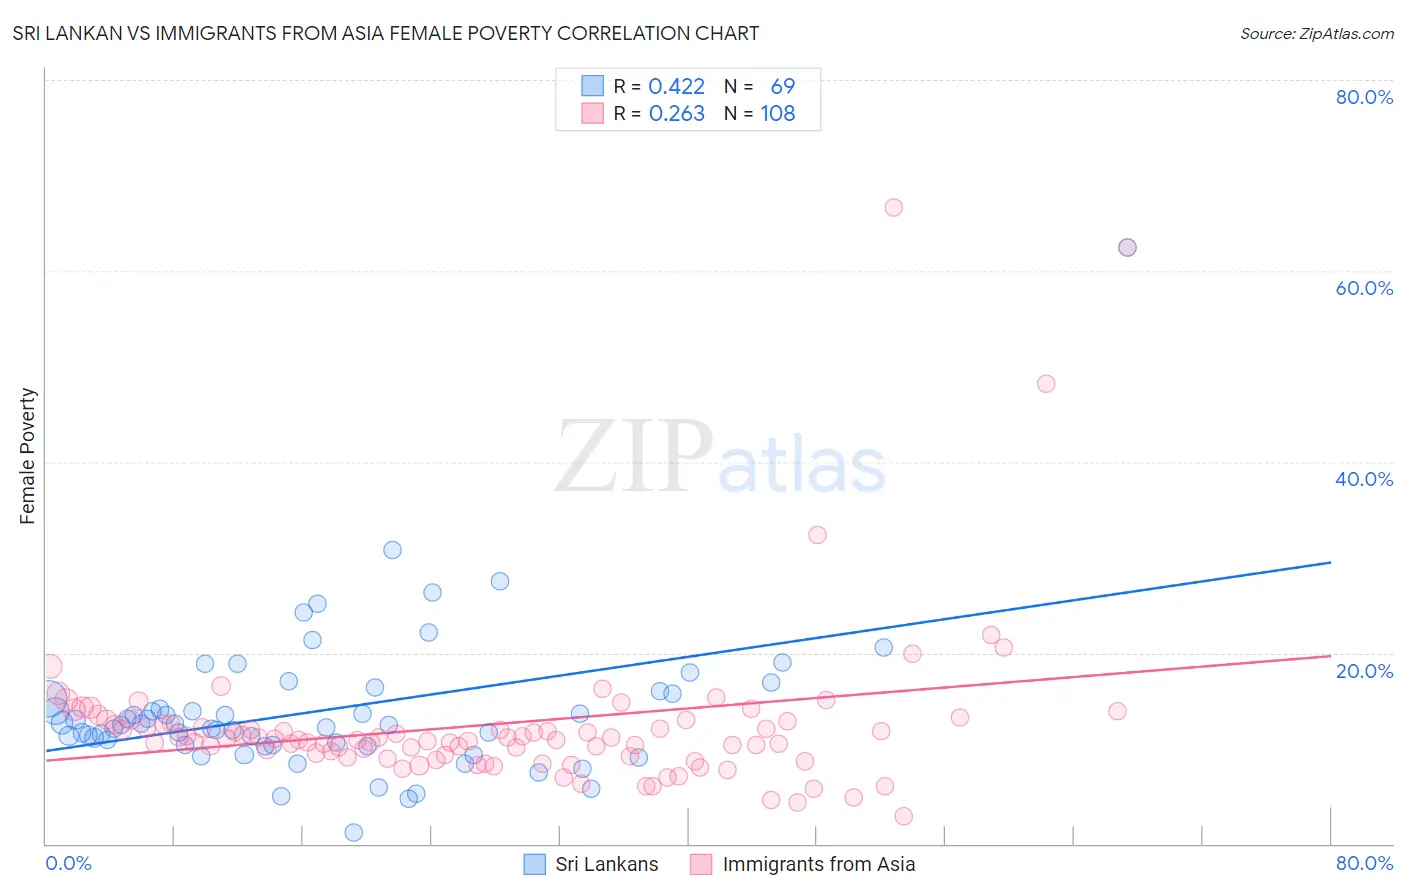
Sri Lankan vs Immigrants from Asia Female Poverty Correlation Chart
The statistical analysis conducted on geographies consisting of 440,042,655 people shows a moderate positive correlation between the proportion of Sri Lankans and poverty level among females in the United States with a correlation coefficient (R) of 0.422 and weighted average of 12.7%. Similarly, the statistical analysis conducted on geographies consisting of 548,172,468 people shows a weak positive correlation between the proportion of Immigrants from Asia and poverty level among females in the United States with a correlation coefficient (R) of 0.263 and weighted average of 12.2%, a difference of 4.3%.
Female Poverty Correlation Summary
| Measurement | Sri Lankan | Immigrants from Asia |
| Minimum | 1.2% | 2.9% |
| Maximum | 62.5% | 66.7% |
| Range | 61.3% | 63.7% |
| Mean | 14.0% | 12.5% |
| Median | 12.5% | 10.9% |
| Interquartile 25% (IQ1) | 10.3% | 9.2% |
| Interquartile 75% (IQ3) | 15.8% | 12.7% |
| Interquartile Range (IQR) | 5.5% | 3.5% |
| Standard Deviation (Sample) | 8.1% | 8.9% |
| Standard Deviation (Population) | 8.0% | 8.8% |
Similar Demographics by Female Poverty
Demographics Similar to Sri Lankans by Female Poverty
In terms of female poverty, the demographic groups most similar to Sri Lankans are Albanian (12.7%, a difference of 0.010%), Immigrants from Southern Europe (12.7%, a difference of 0.020%), New Zealander (12.7%, a difference of 0.070%), Immigrants from Russia (12.7%, a difference of 0.090%), and Immigrants from Hungary (12.7%, a difference of 0.17%).
| Demographics | Rating | Rank | Female Poverty |
| Soviet Union | 92.4 /100 | #111 | Exceptional 12.6% |
| Immigrants | Israel | 92.0 /100 | #112 | Exceptional 12.6% |
| Canadians | 92.0 /100 | #113 | Exceptional 12.7% |
| Welsh | 91.6 /100 | #114 | Exceptional 12.7% |
| Puget Sound Salish | 91.5 /100 | #115 | Exceptional 12.7% |
| Immigrants | Russia | 91.2 /100 | #116 | Exceptional 12.7% |
| Immigrants | Southern Europe | 90.9 /100 | #117 | Exceptional 12.7% |
| Sri Lankans | 90.9 /100 | #118 | Exceptional 12.7% |
| Albanians | 90.8 /100 | #119 | Exceptional 12.7% |
| New Zealanders | 90.6 /100 | #120 | Exceptional 12.7% |
| Immigrants | Hungary | 90.3 /100 | #121 | Exceptional 12.7% |
| French Canadians | 90.2 /100 | #122 | Exceptional 12.7% |
| Immigrants | South Eastern Asia | 89.9 /100 | #123 | Excellent 12.7% |
| Immigrants | Norway | 89.3 /100 | #124 | Excellent 12.8% |
| Argentineans | 89.1 /100 | #125 | Excellent 12.8% |
Demographics Similar to Immigrants from Asia by Female Poverty
In terms of female poverty, the demographic groups most similar to Immigrants from Asia are Immigrants from Australia (12.2%, a difference of 0.0%), Immigrants from Italy (12.2%, a difference of 0.020%), Ukrainian (12.2%, a difference of 0.10%), German (12.2%, a difference of 0.13%), and Indian (Asian) (12.2%, a difference of 0.16%).
| Demographics | Rating | Rank | Female Poverty |
| Immigrants | Philippines | 98.7 /100 | #54 | Exceptional 12.1% |
| Immigrants | Sri Lanka | 98.5 /100 | #55 | Exceptional 12.1% |
| Estonians | 98.3 /100 | #56 | Exceptional 12.1% |
| Immigrants | Serbia | 98.3 /100 | #57 | Exceptional 12.1% |
| Scandinavians | 98.2 /100 | #58 | Exceptional 12.1% |
| Immigrants | Europe | 98.2 /100 | #59 | Exceptional 12.1% |
| Immigrants | Australia | 98.1 /100 | #60 | Exceptional 12.2% |
| Immigrants | Asia | 98.1 /100 | #61 | Exceptional 12.2% |
| Immigrants | Italy | 98.0 /100 | #62 | Exceptional 12.2% |
| Ukrainians | 98.0 /100 | #63 | Exceptional 12.2% |
| Germans | 98.0 /100 | #64 | Exceptional 12.2% |
| Indians (Asian) | 97.9 /100 | #65 | Exceptional 12.2% |
| Austrians | 97.9 /100 | #66 | Exceptional 12.2% |
| Immigrants | Eastern Asia | 97.8 /100 | #67 | Exceptional 12.2% |
| Immigrants | Netherlands | 97.8 /100 | #68 | Exceptional 12.2% |