Spanish vs Slovak Child Poverty Among Boys Under 16

COMPARE

Spanish
Race
Ancestry
AfghanAfricanAlaska NativeAlaskan AthabascanAlbanianAleutAlsatianAmericanApacheArabArapahoArgentineanArmenianAssyrian/Chaldean/SyriacAustralianAustrianBahamianBangladeshiBarbadianBasqueBelgianBelizeanBermudanBhutaneseBlackfeetBolivianBrazilianBritishBritish West IndianBulgarianBurmeseCajunCambodianCanadianCape VerdeanCarpatho RusynCelticCentral AmericanCentral American IndianCherokeeCheyenneChickasawChileanChineseChippewaChoctawColombianColvilleComancheCosta RicanCreeCreekCroatianCrowCubanCypriotCzechCzechoslovakianDanishDelawareDominicanDutchDutch West IndianEastern EuropeanEcuadorianEgyptianEnglishEstonianEthiopianEuropeanFijianFilipinoFinnishFrenchFrench American IndianFrench CanadianGermanGerman RussianGhanaianGreekGuamanian/ChamorroGuatemalanGuyaneseHaitianHmongHonduranHopiHoumaHungarianIcelanderIndian (Asian)IndonesianInupiatIranianIraqiIrishIroquoisIsraeliItalianJamaicanJapaneseJordanianKenyanKiowaKoreanLaotianLatvianLebaneseLiberianLithuanianLumbeeLuxembourgerMacedonianMalaysianMalteseMarshalleseMenomineeMexicanMexican American IndianMongolianMoroccanNative HawaiianNavajoNepaleseNew ZealanderNicaraguanNigerianNorthern EuropeanNorwegianOkinawanOsageOttawaPaiutePakistaniPalestinianPanamanianParaguayanPennsylvania GermanPeruvianPimaPolishPortuguesePotawatomiPuebloPuerto RicanPuget Sound SalishRomanianRussianSalvadoranSamoanScandinavianScotch-IrishScottishSeminoleSenegaleseSerbianShoshoneSierra LeoneanSiouxSlavicSloveneSomaliSouth AfricanSouth AmericanSouth American IndianSoviet UnionSpaniardSpanishSpanish AmericanSpanish American IndianSri LankanSubsaharan AfricanSudaneseSwedishSwissSyrianTaiwaneseThaiTlingit-HaidaTohono O'OdhamTonganTrinidadian and TobagonianTsimshianTurkishU.S. Virgin IslanderUgandanUkrainianUruguayanUteVenezuelanVietnameseWelshWest IndianYakamaYaquiYugoslavianYumanYup'ikZimbabwean
Immigration
NonimmigrantsImmigrantsAfghanistanAfricaAlbaniaArgentinaArmeniaAsiaAustraliaAustriaBahamasBangladeshBarbadosBelarusBelgiumBelizeBoliviaBosnia and HerzegovinaBrazilBulgariaBurma/MyanmarCabo VerdeCambodiaCameroonCanadaCaribbeanCentral AmericaChileChinaColombiaCongoCosta RicaCroatiaCubaCzechoslovakiaDenmarkDominicaDominican RepublicEastern AfricaEastern AsiaEastern EuropeEcuadorEgyptEl SalvadorEnglandEritreaEthiopiaEuropeFijiFranceGermanyGhanaGreeceGrenadaGuatemalaGuyanaHaitiHondurasHong KongHungaryIndiaIndonesiaIranIraqIrelandIsraelItalyJamaicaJapanJordanKazakhstanKenyaKoreaKuwaitLaosLatin AmericaLatviaLebanonLiberiaLithuaniaMalaysiaMexicoMicronesiaMiddle AfricaMoldovaMoroccoNepalNetherlandsNicaraguaNigeriaNorth AmericaNorth MacedoniaNorthern AfricaNorthern EuropeNorwayOceaniaPakistanPanamaPeruPhilippinesPolandPortugalRomaniaRussiaSaudi ArabiaScotlandSenegalSerbiaSierra LeoneSingaporeSomaliaSouth AfricaSouth AmericaSouth Central AsiaSouth Eastern AsiaSouthern EuropeSpainSri LankaSt. Vincent and the GrenadinesSudanSwedenSwitzerlandSyriaTaiwanThailandTrinidad and TobagoTurkeyUgandaUkraineUruguayUzbekistanVenezuelaVietnamWest IndiesWestern AfricaWestern AsiaWestern EuropeYemenZaireZimbabweAzores
Slovak
Race
Ancestry
AfghanAfricanAlaska NativeAlaskan AthabascanAlbanianAleutAlsatianAmericanApacheArabArapahoArgentineanArmenianAssyrian/Chaldean/SyriacAustralianAustrianBahamianBangladeshiBarbadianBasqueBelgianBelizeanBermudanBhutaneseBlackfeetBolivianBrazilianBritishBritish West IndianBulgarianBurmeseCajunCambodianCanadianCape VerdeanCarpatho RusynCelticCentral AmericanCentral American IndianCherokeeCheyenneChickasawChileanChineseChippewaChoctawColombianColvilleComancheCosta RicanCreeCreekCroatianCrowCubanCypriotCzechCzechoslovakianDanishDelawareDominicanDutchDutch West IndianEastern EuropeanEcuadorianEgyptianEnglishEstonianEthiopianEuropeanFijianFilipinoFinnishFrenchFrench American IndianFrench CanadianGermanGerman RussianGhanaianGreekGuamanian/ChamorroGuatemalanGuyaneseHaitianHmongHonduranHopiHoumaHungarianIcelanderIndian (Asian)IndonesianInupiatIranianIraqiIrishIroquoisIsraeliItalianJamaicanJapaneseJordanianKenyanKiowaKoreanLaotianLatvianLebaneseLiberianLithuanianLumbeeLuxembourgerMacedonianMalaysianMalteseMarshalleseMenomineeMexicanMexican American IndianMongolianMoroccanNative HawaiianNavajoNepaleseNew ZealanderNicaraguanNigerianNorthern EuropeanNorwegianOkinawanOsageOttawaPaiutePakistaniPalestinianPanamanianParaguayanPennsylvania GermanPeruvianPimaPolishPortuguesePotawatomiPuebloPuerto RicanPuget Sound SalishRomanianRussianSalvadoranSamoanScandinavianScotch-IrishScottishSeminoleSenegaleseSerbianShoshoneSierra LeoneanSiouxSlavicSlovakSloveneSomaliSouth AfricanSouth AmericanSouth American IndianSoviet UnionSpaniardSpanish AmericanSpanish American IndianSri LankanSubsaharan AfricanSudaneseSwedishSwissSyrianTaiwaneseThaiTlingit-HaidaTohono O'OdhamTonganTrinidadian and TobagonianTsimshianTurkishU.S. Virgin IslanderUgandanUkrainianUruguayanUteVenezuelanVietnameseWelshWest IndianYakamaYaquiYugoslavianYumanYup'ikZimbabwean
Immigration
NonimmigrantsImmigrantsAfghanistanAfricaAlbaniaArgentinaArmeniaAsiaAustraliaAustriaBahamasBangladeshBarbadosBelarusBelgiumBelizeBoliviaBosnia and HerzegovinaBrazilBulgariaBurma/MyanmarCabo VerdeCambodiaCameroonCanadaCaribbeanCentral AmericaChileChinaColombiaCongoCosta RicaCroatiaCubaCzechoslovakiaDenmarkDominicaDominican RepublicEastern AfricaEastern AsiaEastern EuropeEcuadorEgyptEl SalvadorEnglandEritreaEthiopiaEuropeFijiFranceGermanyGhanaGreeceGrenadaGuatemalaGuyanaHaitiHondurasHong KongHungaryIndiaIndonesiaIranIraqIrelandIsraelItalyJamaicaJapanJordanKazakhstanKenyaKoreaKuwaitLaosLatin AmericaLatviaLebanonLiberiaLithuaniaMalaysiaMexicoMicronesiaMiddle AfricaMoldovaMoroccoNepalNetherlandsNicaraguaNigeriaNorth AmericaNorth MacedoniaNorthern AfricaNorthern EuropeNorwayOceaniaPakistanPanamaPeruPhilippinesPolandPortugalRomaniaRussiaSaudi ArabiaScotlandSenegalSerbiaSierra LeoneSingaporeSomaliaSouth AfricaSouth AmericaSouth Central AsiaSouth Eastern AsiaSouthern EuropeSpainSri LankaSt. Vincent and the GrenadinesSudanSwedenSwitzerlandSyriaTaiwanThailandTrinidad and TobagoTurkeyUgandaUkraineUruguayUzbekistanVenezuelaVietnamWest IndiesWestern AfricaWestern AsiaWestern EuropeYemenZaireZimbabweAzores
Child Poverty Among Boys Under 16
Income
Poverty
Unemployment
Labor Participation
Family Structure
Vehicle Availability
Education Level
Disability

Child Poverty Among Boys Under 16 Comparison

Spanish

Slovaks

Fair
Excellent
17.0%
CHILD POVERTY AMONG BOYS UNDER 16
20.8/ 100
METRIC RATING
195th/ 347
METRIC RANK
15.8%
CHILD POVERTY AMONG BOYS UNDER 16
80.3/ 100
METRIC RATING
149th/ 347
METRIC RANK

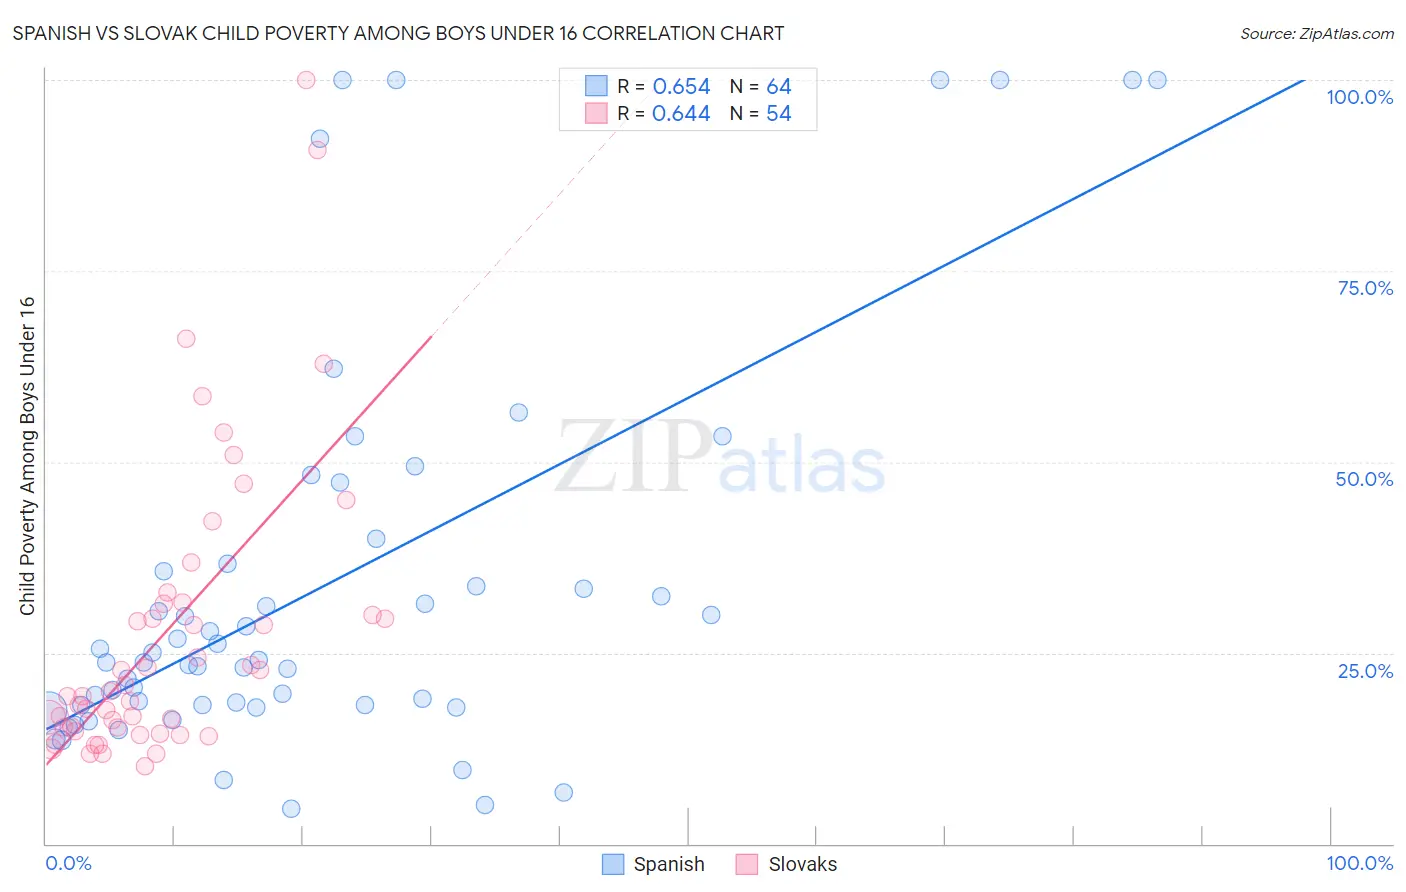
Spanish vs Slovak Child Poverty Among Boys Under 16 Correlation Chart

The statistical analysis conducted on geographies consisting of 415,463,522 people shows a significant positive correlation between the proportion of Spanish and poverty level among boys under the age of 16 in the United States with a correlation coefficient (R) of 0.654 and weighted average of 17.0%. Similarly, the statistical analysis conducted on geographies consisting of 388,579,865 people shows a significant positive correlation between the proportion of Slovaks and poverty level among boys under the age of 16 in the United States with a correlation coefficient (R) of 0.644 and weighted average of 15.8%, a difference of 8.0%.
Spanish vs Slovak Child Poverty Among Boys Under 16

Child Poverty Among Boys Under 16 Correlation Summary

MeasurementSpanishSlovak
Minimum4.6%10.2%
Maximum100.0%100.0%
Range95.4%89.8%
Mean33.7%27.6%
Median23.9%19.6%
Interquartile 25% (IQ1)18.2%15.2%
Interquartile 75% (IQ3)36.2%31.5%
Interquartile Range (IQR)18.0%16.3%
Standard Deviation (Sample)26.1%19.3%
Standard Deviation (Population)25.9%19.2%

Similar Demographics by Child Poverty Among Boys Under 16

Demographics Similar to Spanish by Child Poverty Among Boys Under 16

In terms of child poverty among boys under 16, the demographic groups most similar to Spanish are Spaniard (17.1%, a difference of 0.040%), Immigrants from Lebanon (17.0%, a difference of 0.070%), Immigrants from Kenya (17.1%, a difference of 0.11%), Immigrants from Uganda (17.0%, a difference of 0.14%), and Immigrants from Iraq (17.0%, a difference of 0.14%).
DemographicsRating | RankChild Poverty Among Boys Under 16
Immigrants | South America
37.7
/100
|
#188
Fair
16.7%
Immigrants | Morocco
34.5
/100
|
#189
Fair
16.7%
Arabs
31.1
/100
|
#190
Fair
16.8%
Alaska Natives
29.8
/100
|
#191
Fair
16.8%
Immigrants | Uganda
21.6
/100
|
#192
Fair
17.0%
Immigrants | Iraq
21.6
/100
|
#193
Fair
17.0%
Immigrants | Lebanon
21.2
/100
|
#194
Fair
17.0%
Spanish
20.8
/100
|
#195
Fair
17.0%
Spaniards
20.5
/100
|
#196
Fair
17.1%
Immigrants | Kenya
20.1
/100
|
#197
Fair
17.1%
Immigrants | Cameroon
19.0
/100
|
#198
Poor
17.1%
Delaware
18.8
/100
|
#199
Poor
17.1%
Immigrants | Uruguay
16.9
/100
|
#200
Poor
17.2%
Immigrants | Afghanistan
13.7
/100
|
#201
Poor
17.3%
Immigrants | Sierra Leone
13.4
/100
|
#202
Poor
17.3%

Demographics Similar to Slovaks by Child Poverty Among Boys Under 16

In terms of child poverty among boys under 16, the demographic groups most similar to Slovaks are Immigrants from Jordan (15.8%, a difference of 0.010%), Puget Sound Salish (15.8%, a difference of 0.090%), Brazilian (15.8%, a difference of 0.14%), Immigrants from Venezuela (15.8%, a difference of 0.14%), and French (15.8%, a difference of 0.28%).
DemographicsRating | RankChild Poverty Among Boys Under 16
Immigrants | Hungary
84.1
/100
|
#142
Excellent
15.7%
Immigrants | Fiji
83.6
/100
|
#143
Excellent
15.7%
Immigrants | Peru
83.5
/100
|
#144
Excellent
15.7%
Samoans
83.2
/100
|
#145
Excellent
15.7%
New Zealanders
82.4
/100
|
#146
Excellent
15.7%
Venezuelans
82.1
/100
|
#147
Excellent
15.7%
Brazilians
81.0
/100
|
#148
Excellent
15.8%
Slovaks
80.3
/100
|
#149
Excellent
15.8%
Immigrants | Jordan
80.2
/100
|
#150
Excellent
15.8%
Puget Sound Salish
79.8
/100
|
#151
Good
15.8%
Immigrants | Venezuela
79.5
/100
|
#152
Good
15.8%
French
78.7
/100
|
#153
Good
15.8%
Syrians
77.5
/100
|
#154
Good
15.9%
French Canadians
76.6
/100
|
#155
Good
15.9%
Israelis
76.5
/100
|
#156
Good
15.9%