Spaniard vs German Russian Female Poverty Among 25-34 Year Olds
COMPARE
Spaniard
German Russian
Female Poverty Among 25-34 Year Olds
Female Poverty Among 25-34 Year Olds Comparison
Spaniards
German Russians
14.6%
FEMALE POVERTY AMONG 25-34 YEAR OLDS
2.3/ 100
METRIC RATING
230th/ 347
METRIC RANK
14.9%
FEMALE POVERTY AMONG 25-34 YEAR OLDS
0.8/ 100
METRIC RATING
247th/ 347
METRIC RANK
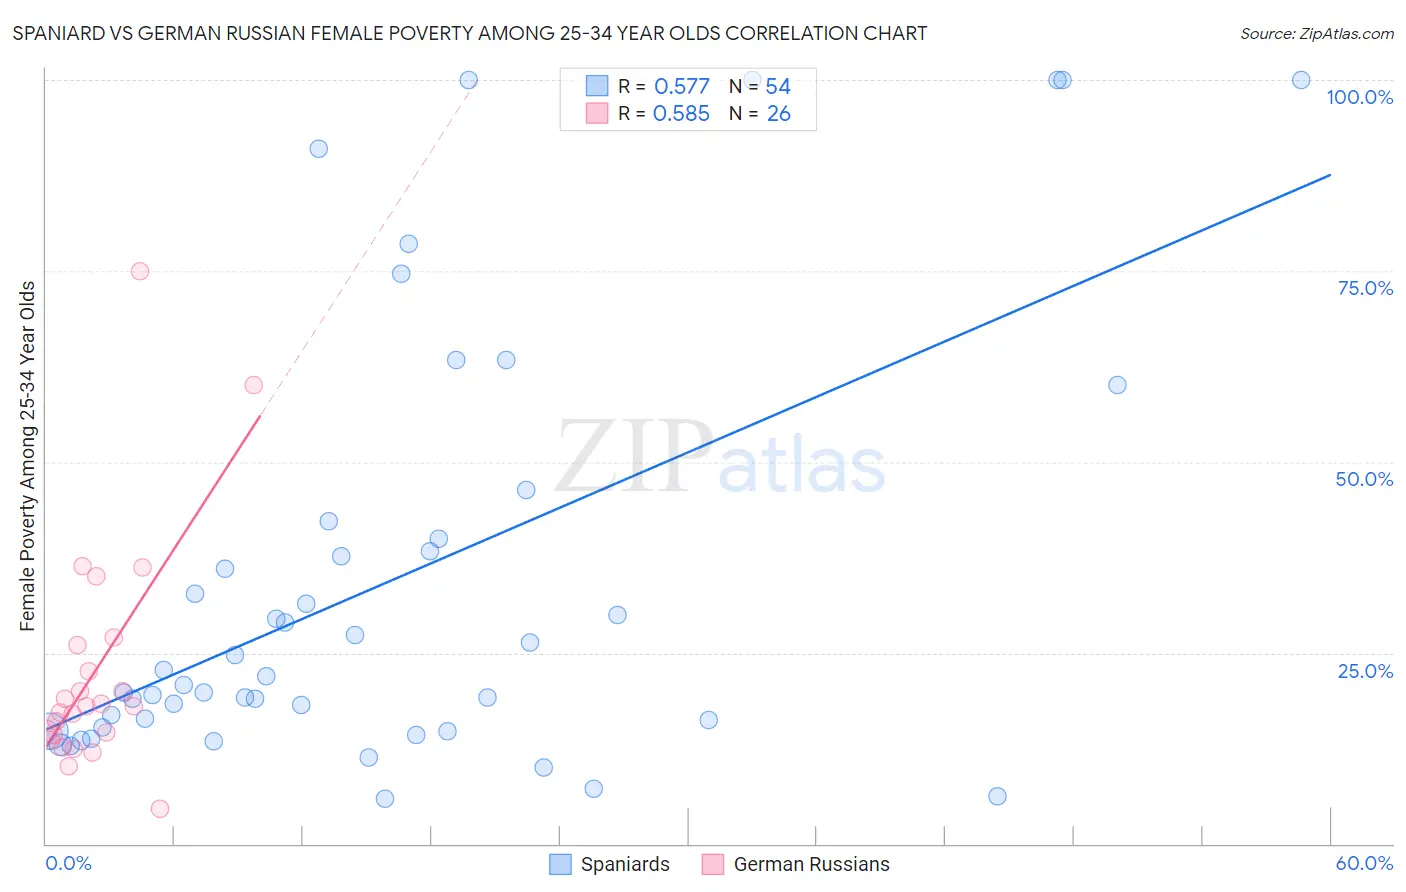
Spaniard vs German Russian Female Poverty Among 25-34 Year Olds Correlation Chart
The statistical analysis conducted on geographies consisting of 435,193,681 people shows a substantial positive correlation between the proportion of Spaniards and poverty level among females between the ages 25 and 34 in the United States with a correlation coefficient (R) of 0.577 and weighted average of 14.6%. Similarly, the statistical analysis conducted on geographies consisting of 96,128,428 people shows a substantial positive correlation between the proportion of German Russians and poverty level among females between the ages 25 and 34 in the United States with a correlation coefficient (R) of 0.585 and weighted average of 14.9%, a difference of 2.0%.
Female Poverty Among 25-34 Year Olds Correlation Summary
| Measurement | Spaniard | German Russian |
| Minimum | 5.9% | 4.7% |
| Maximum | 100.0% | 75.0% |
| Range | 94.1% | 70.3% |
| Mean | 34.4% | 22.7% |
| Median | 21.3% | 18.0% |
| Interquartile 25% (IQ1) | 15.2% | 14.3% |
| Interquartile 75% (IQ3) | 40.0% | 26.1% |
| Interquartile Range (IQR) | 24.8% | 11.8% |
| Standard Deviation (Sample) | 28.1% | 15.4% |
| Standard Deviation (Population) | 27.9% | 15.1% |
Demographics Similar to Spaniards and German Russians by Female Poverty Among 25-34 Year Olds
In terms of female poverty among 25-34 year olds, the demographic groups most similar to Spaniards are Delaware (14.6%, a difference of 0.040%), Spanish (14.6%, a difference of 0.13%), Vietnamese (14.6%, a difference of 0.23%), Immigrants from Ecuador (14.6%, a difference of 0.36%), and White/Caucasian (14.7%, a difference of 0.53%). Similarly, the demographic groups most similar to German Russians are Immigrants from Western Africa (14.9%, a difference of 0.040%), Jamaican (14.8%, a difference of 0.34%), Immigrants from Middle Africa (14.8%, a difference of 0.38%), Immigrants from Bangladesh (14.8%, a difference of 0.56%), and Immigrants from Nicaragua (14.8%, a difference of 0.57%).
| Demographics | Rating | Rank | Female Poverty Among 25-34 Year Olds |
| Vietnamese | 2.6 /100 | #228 | Tragic 14.6% |
| Spanish | 2.5 /100 | #229 | Tragic 14.6% |
| Spaniards | 2.3 /100 | #230 | Tragic 14.6% |
| Delaware | 2.3 /100 | #231 | Tragic 14.6% |
| Immigrants | Ecuador | 1.9 /100 | #232 | Tragic 14.6% |
| Whites/Caucasians | 1.8 /100 | #233 | Tragic 14.7% |
| Cubans | 1.6 /100 | #234 | Tragic 14.7% |
| Immigrants | Jamaica | 1.4 /100 | #235 | Tragic 14.7% |
| Salvadorans | 1.4 /100 | #236 | Tragic 14.7% |
| Immigrants | Ghana | 1.4 /100 | #237 | Tragic 14.7% |
| Alsatians | 1.4 /100 | #238 | Tragic 14.7% |
| Malaysians | 1.4 /100 | #239 | Tragic 14.7% |
| Immigrants | Grenada | 1.3 /100 | #240 | Tragic 14.7% |
| Scotch-Irish | 1.2 /100 | #241 | Tragic 14.8% |
| Barbadians | 1.2 /100 | #242 | Tragic 14.8% |
| Immigrants | Nicaragua | 1.1 /100 | #243 | Tragic 14.8% |
| Immigrants | Bangladesh | 1.1 /100 | #244 | Tragic 14.8% |
| Immigrants | Middle Africa | 1.0 /100 | #245 | Tragic 14.8% |
| Jamaicans | 1.0 /100 | #246 | Tragic 14.8% |
| German Russians | 0.8 /100 | #247 | Tragic 14.9% |
| Immigrants | Western Africa | 0.8 /100 | #248 | Tragic 14.9% |