South African vs Malaysian Family Poverty
COMPARE
South African
Malaysian
Family Poverty
Family Poverty Comparison
South Africans
Malaysians
8.2%
FAMILY POVERTY
93.4/ 100
METRIC RATING
116th/ 347
METRIC RANK
9.6%
FAMILY POVERTY
10.6/ 100
METRIC RATING
211th/ 347
METRIC RANK
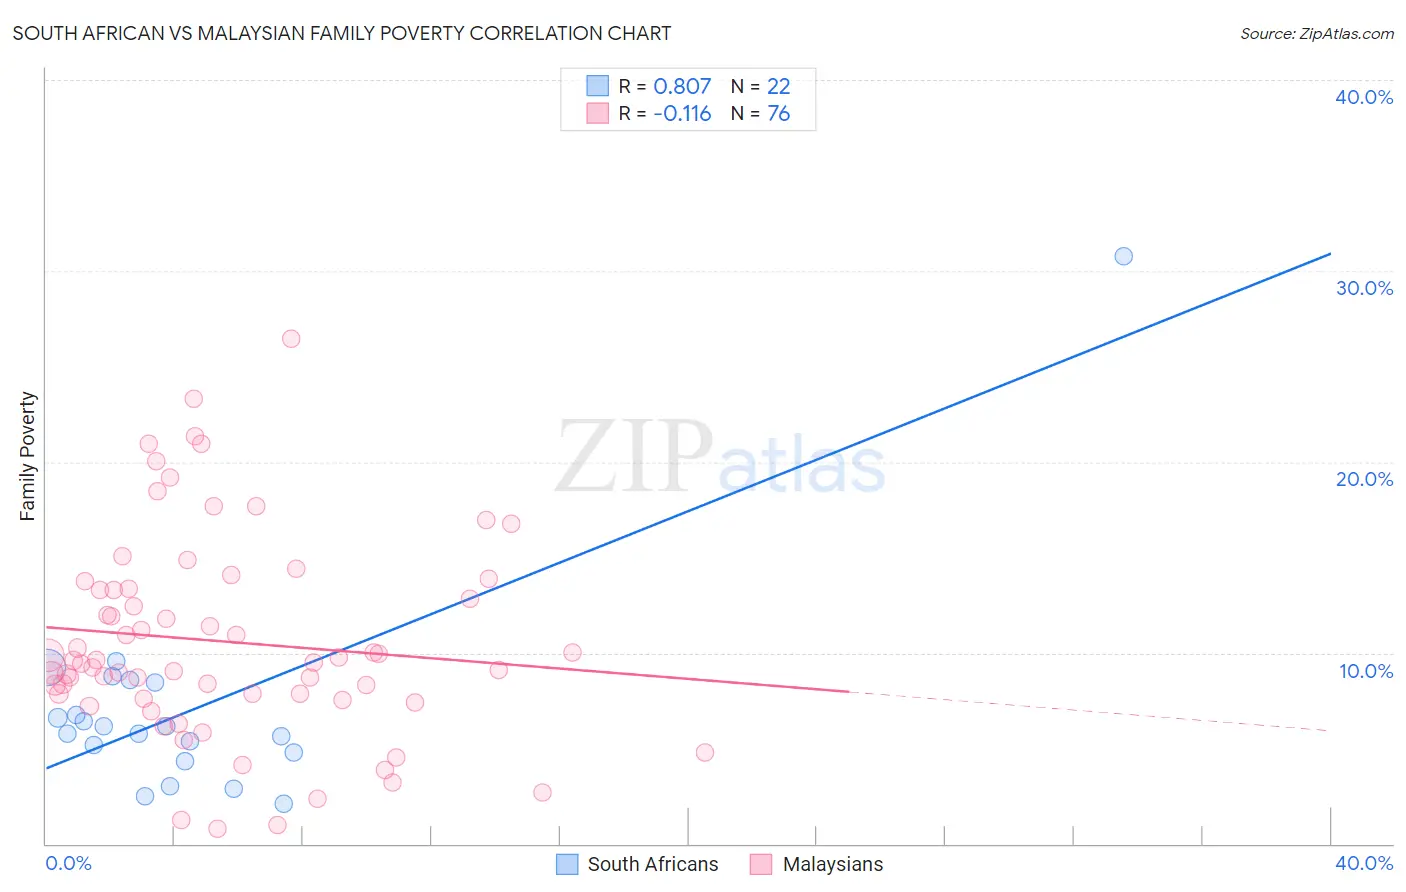
South African vs Malaysian Family Poverty Correlation Chart
The statistical analysis conducted on geographies consisting of 182,354,069 people shows a very strong positive correlation between the proportion of South Africans and poverty level among families in the United States with a correlation coefficient (R) of 0.807 and weighted average of 8.2%. Similarly, the statistical analysis conducted on geographies consisting of 225,820,705 people shows a poor negative correlation between the proportion of Malaysians and poverty level among families in the United States with a correlation coefficient (R) of -0.116 and weighted average of 9.6%, a difference of 17.1%.
Family Poverty Correlation Summary
| Measurement | South African | Malaysian |
| Minimum | 2.1% | 0.81% |
| Maximum | 30.8% | 26.5% |
| Range | 28.7% | 25.6% |
| Mean | 7.0% | 10.6% |
| Median | 6.0% | 9.6% |
| Interquartile 25% (IQ1) | 4.8% | 7.7% |
| Interquartile 75% (IQ3) | 8.4% | 13.3% |
| Interquartile Range (IQR) | 3.7% | 5.6% |
| Standard Deviation (Sample) | 5.7% | 5.3% |
| Standard Deviation (Population) | 5.6% | 5.3% |
Similar Demographics by Family Poverty
Demographics Similar to South Africans by Family Poverty
In terms of family poverty, the demographic groups most similar to South Africans are Immigrants from Israel (8.2%, a difference of 0.060%), Immigrants from Russia (8.2%, a difference of 0.070%), Immigrants from Western Europe (8.2%, a difference of 0.26%), French (8.3%, a difference of 0.33%), and Immigrants from Zimbabwe (8.2%, a difference of 0.41%).
| Demographics | Rating | Rank | Family Poverty |
| Jordanians | 94.8 /100 | #109 | Exceptional 8.2% |
| Romanians | 94.7 /100 | #110 | Exceptional 8.2% |
| Taiwanese | 94.6 /100 | #111 | Exceptional 8.2% |
| Immigrants | France | 94.4 /100 | #112 | Exceptional 8.2% |
| Canadians | 94.2 /100 | #113 | Exceptional 8.2% |
| Immigrants | Zimbabwe | 94.0 /100 | #114 | Exceptional 8.2% |
| Immigrants | Israel | 93.5 /100 | #115 | Exceptional 8.2% |
| South Africans | 93.4 /100 | #116 | Exceptional 8.2% |
| Immigrants | Russia | 93.2 /100 | #117 | Exceptional 8.2% |
| Immigrants | Western Europe | 92.9 /100 | #118 | Exceptional 8.2% |
| French | 92.8 /100 | #119 | Exceptional 8.3% |
| Immigrants | Egypt | 91.6 /100 | #120 | Exceptional 8.3% |
| Native Hawaiians | 91.3 /100 | #121 | Exceptional 8.3% |
| Paraguayans | 91.2 /100 | #122 | Exceptional 8.3% |
| Palestinians | 91.1 /100 | #123 | Exceptional 8.3% |
Demographics Similar to Malaysians by Family Poverty
In terms of family poverty, the demographic groups most similar to Malaysians are Alsatian (9.6%, a difference of 0.23%), Immigrants from Thailand (9.7%, a difference of 0.30%), Osage (9.7%, a difference of 0.94%), Immigrants from Uruguay (9.5%, a difference of 0.97%), and Immigrants from Eastern Africa (9.5%, a difference of 1.3%).
| Demographics | Rating | Rank | Family Poverty |
| Immigrants | Lebanon | 18.9 /100 | #204 | Poor 9.4% |
| Aleuts | 18.0 /100 | #205 | Poor 9.5% |
| Immigrants | South America | 18.0 /100 | #206 | Poor 9.5% |
| Sierra Leoneans | 15.6 /100 | #207 | Poor 9.5% |
| Immigrants | Eastern Africa | 15.1 /100 | #208 | Poor 9.5% |
| Immigrants | Uruguay | 14.0 /100 | #209 | Poor 9.5% |
| Alsatians | 11.3 /100 | #210 | Poor 9.6% |
| Malaysians | 10.6 /100 | #211 | Poor 9.6% |
| Immigrants | Thailand | 9.7 /100 | #212 | Tragic 9.7% |
| Osage | 8.0 /100 | #213 | Tragic 9.7% |
| Immigrants | Micronesia | 6.7 /100 | #214 | Tragic 9.8% |
| Immigrants | Nonimmigrants | 6.7 /100 | #215 | Tragic 9.8% |
| Moroccans | 6.5 /100 | #216 | Tragic 9.8% |
| Americans | 6.2 /100 | #217 | Tragic 9.8% |
| Panamanians | 5.6 /100 | #218 | Tragic 9.8% |