South African vs Immigrants from Sweden Seniors Poverty Over the Age of 65
COMPARE
South African
Immigrants from Sweden
Seniors Poverty Over the Age of 65
Seniors Poverty Over the Age of 65 Comparison
South Africans
Immigrants from Sweden
10.3%
SENIORS POVERTY OVER THE AGE OF 65
94.3/ 100
METRIC RATING
104th/ 347
METRIC RANK
10.1%
SENIORS POVERTY OVER THE AGE OF 65
96.7/ 100
METRIC RATING
93rd/ 347
METRIC RANK
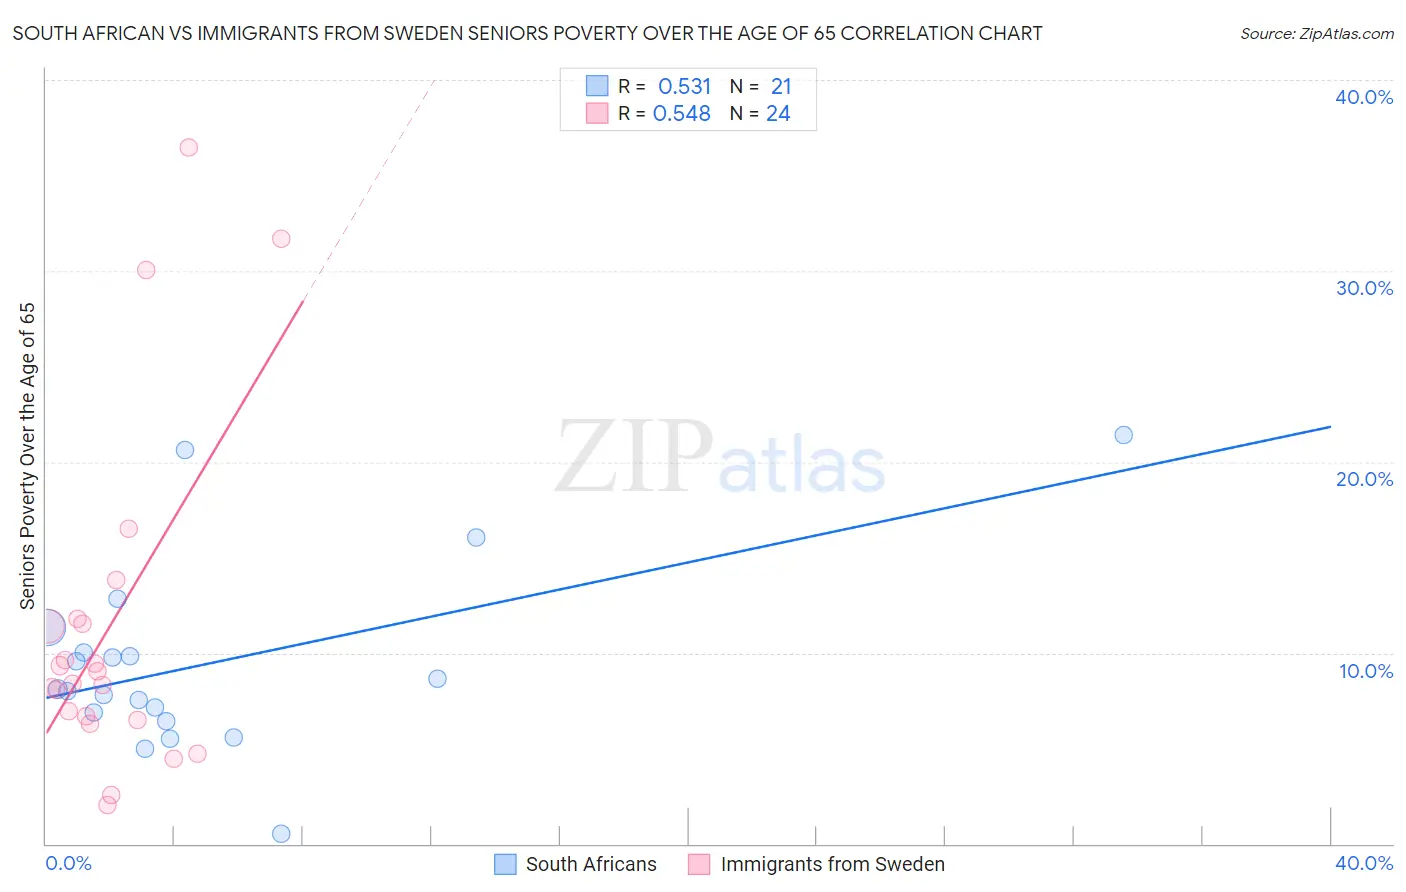
South African vs Immigrants from Sweden Seniors Poverty Over the Age of 65 Correlation Chart
The statistical analysis conducted on geographies consisting of 182,245,174 people shows a substantial positive correlation between the proportion of South Africans and poverty level among seniors over the age of 65 in the United States with a correlation coefficient (R) of 0.531 and weighted average of 10.3%. Similarly, the statistical analysis conducted on geographies consisting of 164,561,963 people shows a substantial positive correlation between the proportion of Immigrants from Sweden and poverty level among seniors over the age of 65 in the United States with a correlation coefficient (R) of 0.548 and weighted average of 10.1%, a difference of 1.4%.
Seniors Poverty Over the Age of 65 Correlation Summary
| Measurement | South African | Immigrants from Sweden |
| Minimum | 0.52% | 2.0% |
| Maximum | 21.4% | 36.5% |
| Range | 20.9% | 34.4% |
| Mean | 9.4% | 11.4% |
| Median | 8.1% | 8.7% |
| Interquartile 25% (IQ1) | 6.7% | 6.6% |
| Interquartile 75% (IQ3) | 10.7% | 11.7% |
| Interquartile Range (IQR) | 4.0% | 5.1% |
| Standard Deviation (Sample) | 5.0% | 8.9% |
| Standard Deviation (Population) | 4.8% | 8.7% |
Demographics Similar to South Africans and Immigrants from Sweden by Seniors Poverty Over the Age of 65
In terms of seniors poverty over the age of 65, the demographic groups most similar to South Africans are Icelander (10.3%, a difference of 0.040%), Aleut (10.3%, a difference of 0.070%), Delaware (10.2%, a difference of 0.090%), Kenyan (10.3%, a difference of 0.090%), and Hawaiian (10.3%, a difference of 0.16%). Similarly, the demographic groups most similar to Immigrants from Sweden are Immigrants from Germany (10.1%, a difference of 0.070%), Immigrants from Singapore (10.1%, a difference of 0.11%), Puget Sound Salish (10.1%, a difference of 0.13%), Ukrainian (10.1%, a difference of 0.15%), and Immigrants from Bulgaria (10.1%, a difference of 0.21%).
| Demographics | Rating | Rank | Seniors Poverty Over the Age of 65 |
| Jordanians | 97.1 /100 | #88 | Exceptional 10.1% |
| Immigrants | Bulgaria | 97.0 /100 | #89 | Exceptional 10.1% |
| Ukrainians | 96.9 /100 | #90 | Exceptional 10.1% |
| Puget Sound Salish | 96.9 /100 | #91 | Exceptional 10.1% |
| Immigrants | Singapore | 96.9 /100 | #92 | Exceptional 10.1% |
| Immigrants | Sweden | 96.7 /100 | #93 | Exceptional 10.1% |
| Immigrants | Germany | 96.7 /100 | #94 | Exceptional 10.1% |
| Immigrants | Japan | 96.3 /100 | #95 | Exceptional 10.1% |
| Basques | 95.9 /100 | #96 | Exceptional 10.2% |
| Immigrants | Pakistan | 95.7 /100 | #97 | Exceptional 10.2% |
| Immigrants | Kuwait | 95.5 /100 | #98 | Exceptional 10.2% |
| Cypriots | 95.5 /100 | #99 | Exceptional 10.2% |
| Marshallese | 95.3 /100 | #100 | Exceptional 10.2% |
| Immigrants | Jordan | 94.7 /100 | #101 | Exceptional 10.2% |
| Delaware | 94.5 /100 | #102 | Exceptional 10.2% |
| Icelanders | 94.4 /100 | #103 | Exceptional 10.3% |
| South Africans | 94.3 /100 | #104 | Exceptional 10.3% |
| Aleuts | 94.1 /100 | #105 | Exceptional 10.3% |
| Kenyans | 94.1 /100 | #106 | Exceptional 10.3% |
| Hawaiians | 93.9 /100 | #107 | Exceptional 10.3% |
| Immigrants | Croatia | 93.9 /100 | #108 | Exceptional 10.3% |