South African vs Immigrants from Poland Child Poverty Under the Age of 5

COMPARE

South African
Race
Ancestry
AfghanAfricanAlaska NativeAlaskan AthabascanAlbanianAleutAlsatianAmericanApacheArabArapahoArgentineanArmenianAssyrian/Chaldean/SyriacAustralianAustrianBahamianBangladeshiBarbadianBasqueBelgianBelizeanBermudanBhutaneseBlackfeetBolivianBrazilianBritishBritish West IndianBulgarianBurmeseCajunCambodianCanadianCape VerdeanCarpatho RusynCelticCentral AmericanCentral American IndianCherokeeCheyenneChickasawChileanChineseChippewaChoctawColombianColvilleComancheCosta RicanCreeCreekCroatianCrowCubanCypriotCzechCzechoslovakianDanishDelawareDominicanDutchDutch West IndianEastern EuropeanEcuadorianEgyptianEnglishEstonianEthiopianEuropeanFijianFilipinoFinnishFrenchFrench American IndianFrench CanadianGermanGerman RussianGhanaianGreekGuamanian/ChamorroGuatemalanGuyaneseHaitianHmongHonduranHopiHoumaHungarianIcelanderIndian (Asian)IndonesianInupiatIranianIraqiIrishIroquoisIsraeliItalianJamaicanJapaneseJordanianKenyanKiowaKoreanLaotianLatvianLebaneseLiberianLithuanianLumbeeLuxembourgerMacedonianMalaysianMalteseMarshalleseMenomineeMexicanMexican American IndianMongolianMoroccanNative HawaiianNavajoNepaleseNew ZealanderNicaraguanNigerianNorthern EuropeanNorwegianOkinawanOsageOttawaPaiutePakistaniPalestinianPanamanianParaguayanPennsylvania GermanPeruvianPimaPolishPortuguesePotawatomiPuebloPuerto RicanPuget Sound SalishRomanianRussianSalvadoranSamoanScandinavianScotch-IrishScottishSeminoleSenegaleseSerbianShoshoneSierra LeoneanSiouxSlavicSlovakSloveneSomaliSouth AfricanSouth AmericanSouth American IndianSoviet UnionSpaniardSpanishSpanish AmericanSpanish American IndianSri LankanSubsaharan AfricanSudaneseSwedishSwissSyrianTaiwaneseThaiTlingit-HaidaTohono O'OdhamTonganTrinidadian and TobagonianTsimshianTurkishU.S. Virgin IslanderUgandanUkrainianUruguayanUteVenezuelanVietnameseWelshWest IndianYakamaYaquiYugoslavianYumanYup'ikZimbabwean
Immigration
NonimmigrantsImmigrantsAfghanistanAfricaAlbaniaArgentinaArmeniaAsiaAustraliaAustriaBahamasBangladeshBarbadosBelarusBelgiumBelizeBoliviaBosnia and HerzegovinaBrazilBulgariaBurma/MyanmarCabo VerdeCambodiaCameroonCanadaCaribbeanCentral AmericaChileChinaColombiaCongoCosta RicaCroatiaCubaCzechoslovakiaDenmarkDominicaDominican RepublicEastern AfricaEastern AsiaEastern EuropeEcuadorEgyptEl SalvadorEnglandEritreaEthiopiaEuropeFijiFranceGermanyGhanaGreeceGrenadaGuatemalaGuyanaHaitiHondurasHong KongHungaryIndiaIndonesiaIranIraqIrelandIsraelItalyJamaicaJapanJordanKazakhstanKenyaKoreaKuwaitLaosLatin AmericaLatviaLebanonLiberiaLithuaniaMalaysiaMexicoMicronesiaMiddle AfricaMoldovaMoroccoNepalNetherlandsNicaraguaNigeriaNorth AmericaNorth MacedoniaNorthern AfricaNorthern EuropeNorwayOceaniaPakistanPanamaPeruPhilippinesPortugalRomaniaRussiaSaudi ArabiaScotlandSenegalSerbiaSierra LeoneSingaporeSomaliaSouth AfricaSouth AmericaSouth Central AsiaSouth Eastern AsiaSouthern EuropeSpainSri LankaSt. Vincent and the GrenadinesSudanSwedenSwitzerlandSyriaTaiwanThailandTrinidad and TobagoTurkeyUgandaUkraineUruguayUzbekistanVenezuelaVietnamWest IndiesWestern AfricaWestern AsiaWestern EuropeYemenZaireZimbabweAzores
Immigrants from Poland
Race
Ancestry
AfghanAfricanAlaska NativeAlaskan AthabascanAlbanianAleutAlsatianAmericanApacheArabArapahoArgentineanArmenianAssyrian/Chaldean/SyriacAustralianAustrianBahamianBangladeshiBarbadianBasqueBelgianBelizeanBermudanBhutaneseBlackfeetBolivianBrazilianBritishBritish West IndianBulgarianBurmeseCajunCambodianCanadianCape VerdeanCarpatho RusynCelticCentral AmericanCentral American IndianCherokeeCheyenneChickasawChileanChineseChippewaChoctawColombianColvilleComancheCosta RicanCreeCreekCroatianCrowCubanCypriotCzechCzechoslovakianDanishDelawareDominicanDutchDutch West IndianEastern EuropeanEcuadorianEgyptianEnglishEstonianEthiopianEuropeanFijianFilipinoFinnishFrenchFrench American IndianFrench CanadianGermanGerman RussianGhanaianGreekGuamanian/ChamorroGuatemalanGuyaneseHaitianHmongHonduranHopiHoumaHungarianIcelanderIndian (Asian)IndonesianInupiatIranianIraqiIrishIroquoisIsraeliItalianJamaicanJapaneseJordanianKenyanKiowaKoreanLaotianLatvianLebaneseLiberianLithuanianLumbeeLuxembourgerMacedonianMalaysianMalteseMarshalleseMenomineeMexicanMexican American IndianMongolianMoroccanNative HawaiianNavajoNepaleseNew ZealanderNicaraguanNigerianNorthern EuropeanNorwegianOkinawanOsageOttawaPaiutePakistaniPalestinianPanamanianParaguayanPennsylvania GermanPeruvianPimaPolishPortuguesePotawatomiPuebloPuerto RicanPuget Sound SalishRomanianRussianSalvadoranSamoanScandinavianScotch-IrishScottishSeminoleSenegaleseSerbianShoshoneSierra LeoneanSiouxSlavicSlovakSloveneSomaliSouth AmericanSouth American IndianSoviet UnionSpaniardSpanishSpanish AmericanSpanish American IndianSri LankanSubsaharan AfricanSudaneseSwedishSwissSyrianTaiwaneseThaiTlingit-HaidaTohono O'OdhamTonganTrinidadian and TobagonianTsimshianTurkishU.S. Virgin IslanderUgandanUkrainianUruguayanUteVenezuelanVietnameseWelshWest IndianYakamaYaquiYugoslavianYumanYup'ikZimbabwean
Immigration
NonimmigrantsImmigrantsAfghanistanAfricaAlbaniaArgentinaArmeniaAsiaAustraliaAustriaBahamasBangladeshBarbadosBelarusBelgiumBelizeBoliviaBosnia and HerzegovinaBrazilBulgariaBurma/MyanmarCabo VerdeCambodiaCameroonCanadaCaribbeanCentral AmericaChileChinaColombiaCongoCosta RicaCroatiaCubaCzechoslovakiaDenmarkDominicaDominican RepublicEastern AfricaEastern AsiaEastern EuropeEcuadorEgyptEl SalvadorEnglandEritreaEthiopiaEuropeFijiFranceGermanyGhanaGreeceGrenadaGuatemalaGuyanaHaitiHondurasHong KongHungaryIndiaIndonesiaIranIraqIrelandIsraelItalyJamaicaJapanJordanKazakhstanKenyaKoreaKuwaitLaosLatin AmericaLatviaLebanonLiberiaLithuaniaMalaysiaMexicoMicronesiaMiddle AfricaMoldovaMoroccoNepalNetherlandsNicaraguaNigeriaNorth AmericaNorth MacedoniaNorthern AfricaNorthern EuropeNorwayOceaniaPakistanPanamaPeruPhilippinesPolandPortugalRomaniaRussiaSaudi ArabiaScotlandSenegalSerbiaSierra LeoneSingaporeSomaliaSouth AfricaSouth AmericaSouth Central AsiaSouth Eastern AsiaSouthern EuropeSpainSri LankaSt. Vincent and the GrenadinesSudanSwedenSwitzerlandSyriaTaiwanThailandTrinidad and TobagoTurkeyUgandaUkraineUruguayUzbekistanVenezuelaVietnamWest IndiesWestern AfricaWestern AsiaWestern EuropeYemenZaireZimbabweAzores
Child Poverty Under the Age of 5
Income
Poverty
Unemployment
Labor Participation
Family Structure
Vehicle Availability
Education Level
Disability

Child Poverty Under the Age of 5 Comparison

South Africans

Immigrants from Poland

Exceptional
Exceptional
16.2%
CHILD POVERTY UNDER THE AGE OF 5
90.1/ 100
METRIC RATING
128th/ 347
METRIC RANK
15.1%
CHILD POVERTY UNDER THE AGE OF 5
99.1/ 100
METRIC RATING
61st/ 347
METRIC RANK

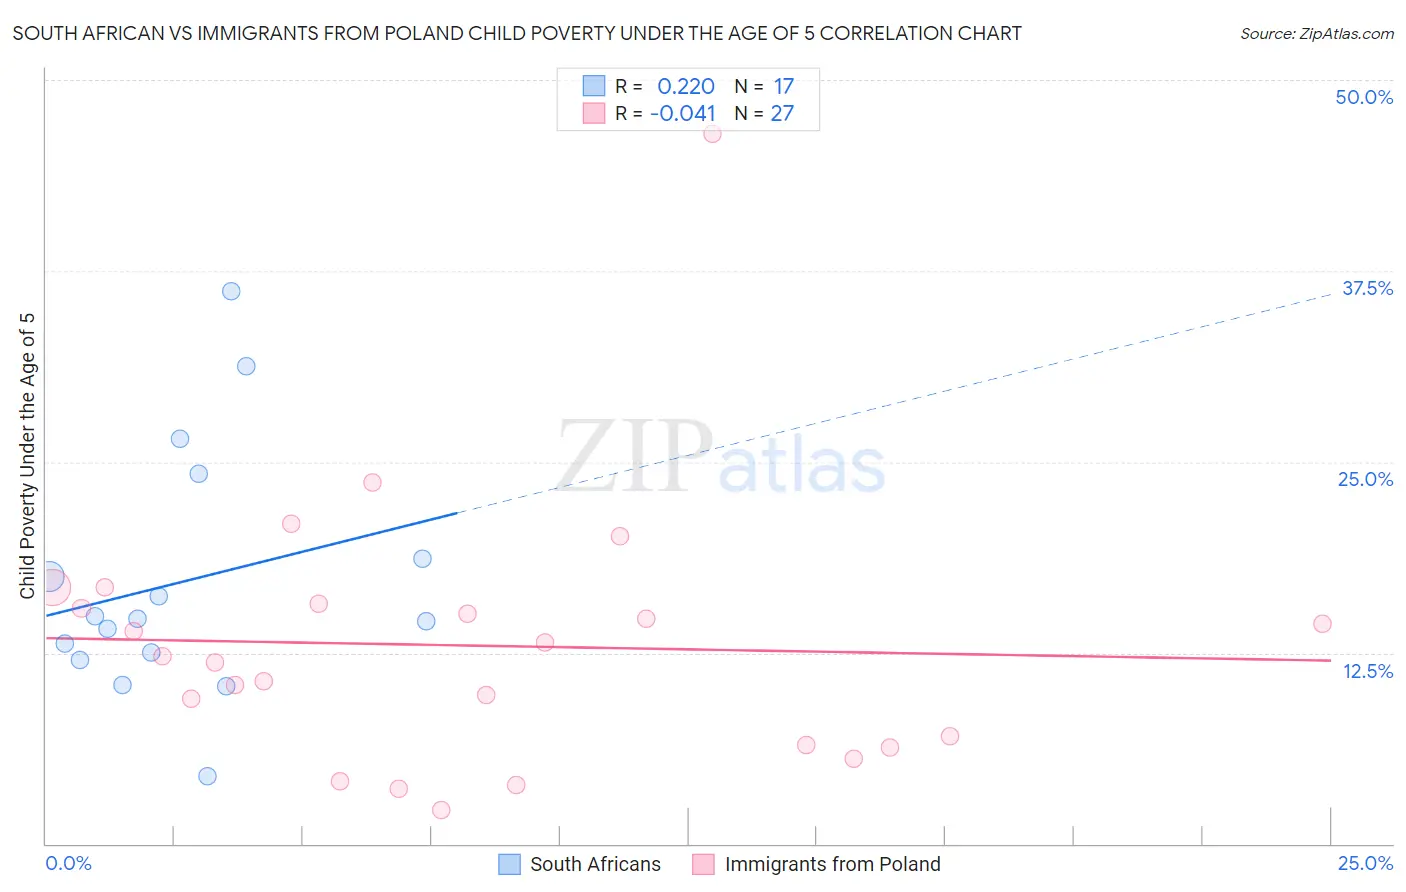
South African vs Immigrants from Poland Child Poverty Under the Age of 5 Correlation Chart

The statistical analysis conducted on geographies consisting of 177,239,967 people shows a weak positive correlation between the proportion of South Africans and poverty level among children under the age of 5 in the United States with a correlation coefficient (R) of 0.220 and weighted average of 16.2%. Similarly, the statistical analysis conducted on geographies consisting of 290,713,862 people shows no correlation between the proportion of Immigrants from Poland and poverty level among children under the age of 5 in the United States with a correlation coefficient (R) of -0.041 and weighted average of 15.1%, a difference of 7.5%.
South African vs Immigrants from Poland Child Poverty Under the Age of 5

Child Poverty Under the Age of 5 Correlation Summary

MeasurementSouth AfricanImmigrants from Poland
Minimum4.4%2.2%
Maximum36.2%46.5%
Range31.8%44.3%
Mean17.2%13.0%
Median14.7%12.3%
Interquartile 25% (IQ1)12.3%6.5%
Interquartile 75% (IQ3)21.4%15.7%
Interquartile Range (IQR)9.1%9.2%
Standard Deviation (Sample)8.1%8.7%
Standard Deviation (Population)7.8%8.6%

Similar Demographics by Child Poverty Under the Age of 5

Demographics Similar to South Africans by Child Poverty Under the Age of 5

In terms of child poverty under the age of 5, the demographic groups most similar to South Africans are British (16.3%, a difference of 0.18%), Immigrants from Norway (16.3%, a difference of 0.21%), Immigrants from England (16.2%, a difference of 0.49%), Finnish (16.3%, a difference of 0.51%), and Serbian (16.3%, a difference of 0.54%).
DemographicsRating | RankChild Poverty Under the Age of 5
Mongolians
92.5
/100
|
#121
Exceptional
16.1%
Immigrants | Southern Europe
92.0
/100
|
#122
Exceptional
16.1%
Austrians
92.0
/100
|
#123
Exceptional
16.1%
Swiss
92.0
/100
|
#124
Exceptional
16.1%
Native Hawaiians
91.8
/100
|
#125
Exceptional
16.2%
Immigrants | Albania
91.8
/100
|
#126
Exceptional
16.2%
Immigrants | England
91.5
/100
|
#127
Exceptional
16.2%
South Africans
90.1
/100
|
#128
Exceptional
16.2%
British
89.4
/100
|
#129
Excellent
16.3%
Immigrants | Norway
89.3
/100
|
#130
Excellent
16.3%
Finns
88.3
/100
|
#131
Excellent
16.3%
Serbians
88.2
/100
|
#132
Excellent
16.3%
Icelanders
87.9
/100
|
#133
Excellent
16.3%
Immigrants | North Macedonia
87.8
/100
|
#134
Excellent
16.4%
Brazilians
87.8
/100
|
#135
Excellent
16.4%

Demographics Similar to Immigrants from Poland by Child Poverty Under the Age of 5

In terms of child poverty under the age of 5, the demographic groups most similar to Immigrants from Poland are Immigrants from Eastern Europe (15.1%, a difference of 0.12%), Immigrants from Europe (15.1%, a difference of 0.25%), Immigrants from Romania (15.2%, a difference of 0.27%), Immigrants from Fiji (15.2%, a difference of 0.30%), and Immigrants from Scotland (15.2%, a difference of 0.42%).
DemographicsRating | RankChild Poverty Under the Age of 5
Immigrants | Israel
99.4
/100
|
#54
Exceptional
14.9%
Danes
99.4
/100
|
#55
Exceptional
14.9%
Immigrants | Pakistan
99.4
/100
|
#56
Exceptional
14.9%
Egyptians
99.4
/100
|
#57
Exceptional
14.9%
Swedes
99.4
/100
|
#58
Exceptional
15.0%
Paraguayans
99.4
/100
|
#59
Exceptional
15.0%
Immigrants | Russia
99.3
/100
|
#60
Exceptional
15.0%
Immigrants | Poland
99.1
/100
|
#61
Exceptional
15.1%
Immigrants | Eastern Europe
99.1
/100
|
#62
Exceptional
15.1%
Immigrants | Europe
99.1
/100
|
#63
Exceptional
15.1%
Immigrants | Romania
99.1
/100
|
#64
Exceptional
15.2%
Immigrants | Fiji
99.0
/100
|
#65
Exceptional
15.2%
Immigrants | Scotland
99.0
/100
|
#66
Exceptional
15.2%
Greeks
99.0
/100
|
#67
Exceptional
15.2%
Zimbabweans
99.0
/100
|
#68
Exceptional
15.2%