Somali vs Polish Single Father Poverty
COMPARE
Somali
Polish
Single Father Poverty
Single Father Poverty Comparison
Somalis
Poles
14.5%
SINGLE FATHER POVERTY
100.0/ 100
METRIC RATING
29th/ 347
METRIC RANK
17.3%
SINGLE FATHER POVERTY
0.3/ 100
METRIC RATING
265th/ 347
METRIC RANK
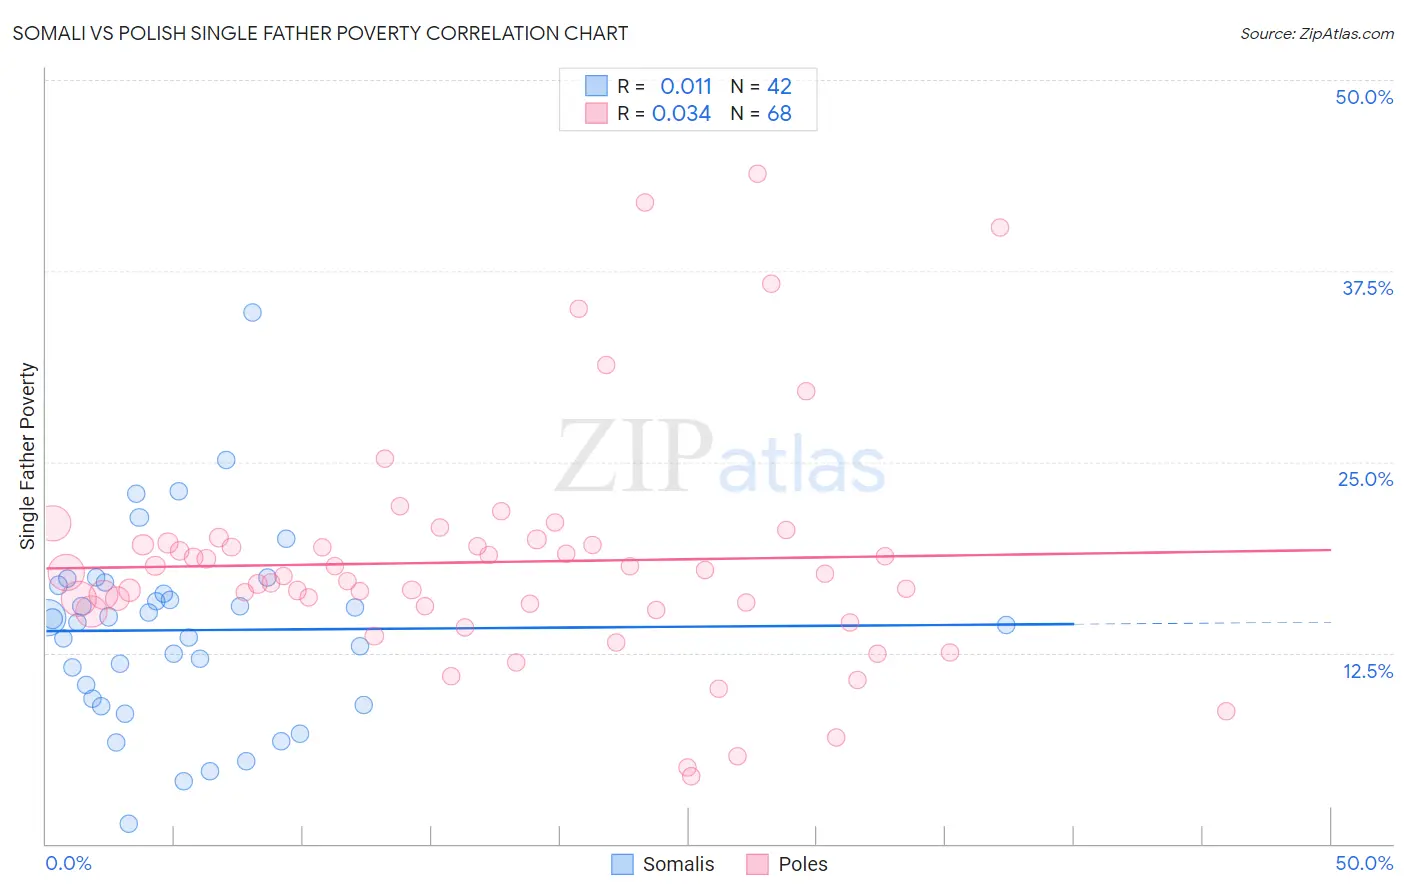
Somali vs Polish Single Father Poverty Correlation Chart
The statistical analysis conducted on geographies consisting of 90,638,192 people shows no correlation between the proportion of Somalis and poverty level among single fathers in the United States with a correlation coefficient (R) of 0.011 and weighted average of 14.5%. Similarly, the statistical analysis conducted on geographies consisting of 402,702,262 people shows no correlation between the proportion of Poles and poverty level among single fathers in the United States with a correlation coefficient (R) of 0.034 and weighted average of 17.3%, a difference of 19.3%.
Single Father Poverty Correlation Summary
| Measurement | Somali | Polish |
| Minimum | 1.3% | 4.5% |
| Maximum | 34.8% | 43.8% |
| Range | 33.5% | 39.4% |
| Mean | 14.0% | 18.4% |
| Median | 14.6% | 17.6% |
| Interquartile 25% (IQ1) | 9.5% | 15.4% |
| Interquartile 75% (IQ3) | 16.9% | 19.6% |
| Interquartile Range (IQR) | 7.4% | 4.2% |
| Standard Deviation (Sample) | 6.2% | 7.7% |
| Standard Deviation (Population) | 6.1% | 7.6% |
Similar Demographics by Single Father Poverty
Demographics Similar to Somalis by Single Father Poverty
In terms of single father poverty, the demographic groups most similar to Somalis are Thai (14.5%, a difference of 0.040%), Immigrants from South Central Asia (14.5%, a difference of 0.11%), Icelander (14.5%, a difference of 0.13%), Asian (14.6%, a difference of 0.28%), and Nepalese (14.4%, a difference of 0.64%).
| Demographics | Rating | Rank | Single Father Poverty |
| Taiwanese | 100.0 /100 | #22 | Exceptional 14.3% |
| Immigrants | Egypt | 100.0 /100 | #23 | Exceptional 14.4% |
| Immigrants | South Eastern Asia | 100.0 /100 | #24 | Exceptional 14.4% |
| Iranians | 100.0 /100 | #25 | Exceptional 14.4% |
| Spanish American Indians | 100.0 /100 | #26 | Exceptional 14.4% |
| Nepalese | 100.0 /100 | #27 | Exceptional 14.4% |
| Immigrants | South Central Asia | 100.0 /100 | #28 | Exceptional 14.5% |
| Somalis | 100.0 /100 | #29 | Exceptional 14.5% |
| Thais | 100.0 /100 | #30 | Exceptional 14.5% |
| Icelanders | 100.0 /100 | #31 | Exceptional 14.5% |
| Asians | 100.0 /100 | #32 | Exceptional 14.6% |
| Okinawans | 100.0 /100 | #33 | Exceptional 14.6% |
| Egyptians | 100.0 /100 | #34 | Exceptional 14.7% |
| Immigrants | Bolivia | 100.0 /100 | #35 | Exceptional 14.7% |
| Immigrants | Indonesia | 100.0 /100 | #36 | Exceptional 14.7% |
Demographics Similar to Poles by Single Father Poverty
In terms of single father poverty, the demographic groups most similar to Poles are Slovene (17.3%, a difference of 0.0%), Jamaican (17.3%, a difference of 0.060%), Haitian (17.3%, a difference of 0.090%), Immigrants from Caribbean (17.4%, a difference of 0.19%), and Lithuanian (17.3%, a difference of 0.21%).
| Demographics | Rating | Rank | Single Father Poverty |
| Albanians | 0.7 /100 | #258 | Tragic 17.2% |
| Immigrants | Jamaica | 0.7 /100 | #259 | Tragic 17.2% |
| Spaniards | 0.6 /100 | #260 | Tragic 17.2% |
| Swiss | 0.5 /100 | #261 | Tragic 17.3% |
| Immigrants | Zaire | 0.4 /100 | #262 | Tragic 17.3% |
| Lithuanians | 0.4 /100 | #263 | Tragic 17.3% |
| Slovenes | 0.3 /100 | #264 | Tragic 17.3% |
| Poles | 0.3 /100 | #265 | Tragic 17.3% |
| Jamaicans | 0.3 /100 | #266 | Tragic 17.3% |
| Haitians | 0.3 /100 | #267 | Tragic 17.3% |
| Immigrants | Caribbean | 0.3 /100 | #268 | Tragic 17.4% |
| Slavs | 0.3 /100 | #269 | Tragic 17.4% |
| Indonesians | 0.2 /100 | #270 | Tragic 17.4% |
| French American Indians | 0.2 /100 | #271 | Tragic 17.4% |
| Barbadians | 0.1 /100 | #272 | Tragic 17.5% |