Slovene vs Spanish Poverty
COMPARE
Slovene
Spanish
Poverty
Poverty Comparison
Slovenes
Spanish
11.0%
POVERTY
98.9/ 100
METRIC RATING
48th/ 347
METRIC RANK
12.8%
POVERTY
18.7/ 100
METRIC RATING
198th/ 347
METRIC RANK
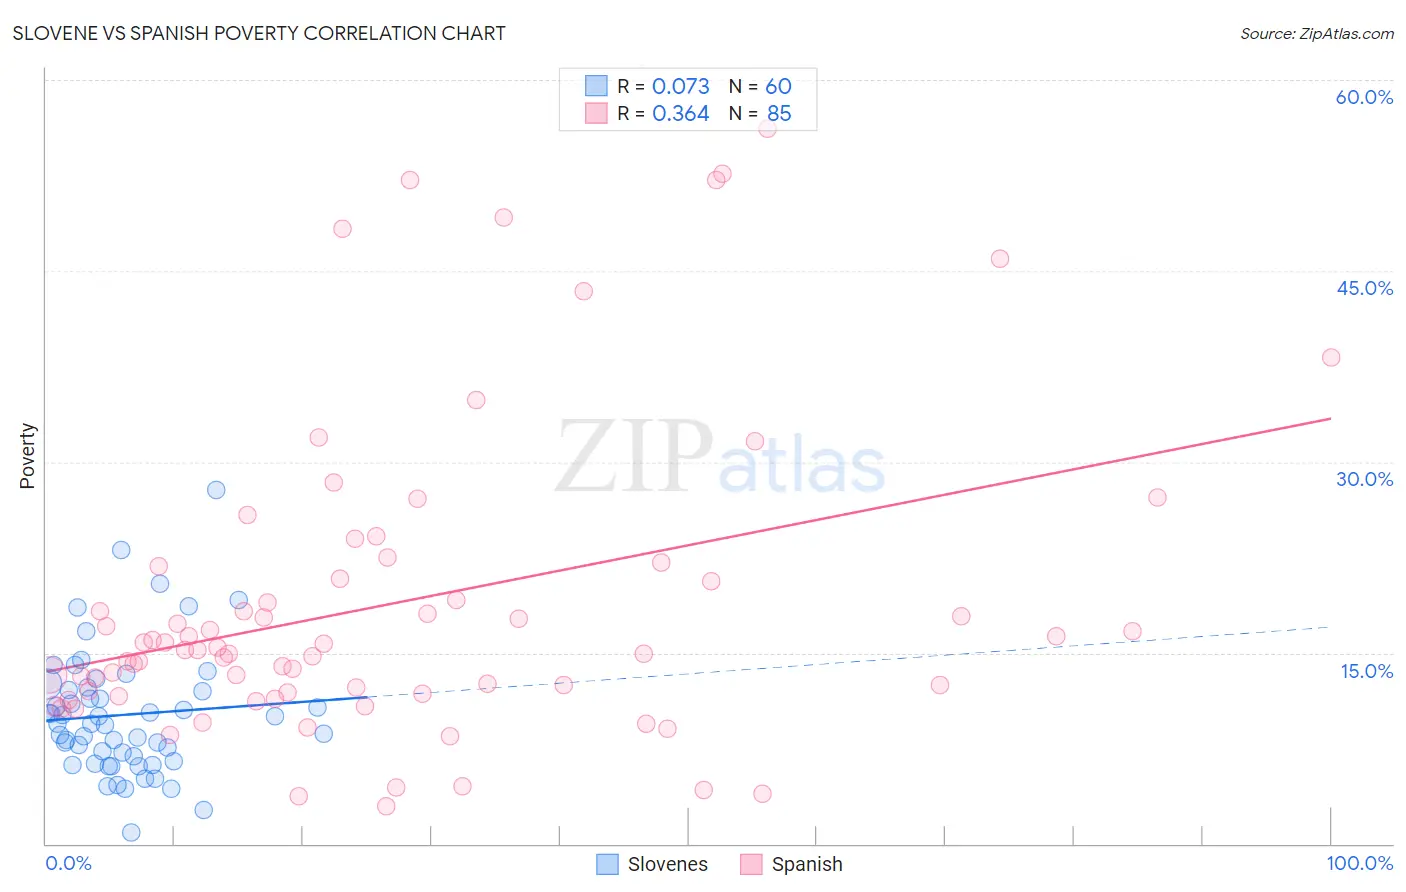
Slovene vs Spanish Poverty Correlation Chart
The statistical analysis conducted on geographies consisting of 261,264,546 people shows a slight positive correlation between the proportion of Slovenes and poverty level in the United States with a correlation coefficient (R) of 0.073 and weighted average of 11.0%. Similarly, the statistical analysis conducted on geographies consisting of 421,940,954 people shows a mild positive correlation between the proportion of Spanish and poverty level in the United States with a correlation coefficient (R) of 0.364 and weighted average of 12.8%, a difference of 16.2%.
Poverty Correlation Summary
| Measurement | Slovene | Spanish |
| Minimum | 0.91% | 3.0% |
| Maximum | 27.8% | 56.1% |
| Range | 26.9% | 53.2% |
| Mean | 10.1% | 18.9% |
| Median | 9.4% | 15.2% |
| Interquartile 25% (IQ1) | 6.6% | 11.8% |
| Interquartile 75% (IQ3) | 12.2% | 21.3% |
| Interquartile Range (IQR) | 5.6% | 9.5% |
| Standard Deviation (Sample) | 5.0% | 12.1% |
| Standard Deviation (Population) | 4.9% | 12.1% |
Similar Demographics by Poverty
Demographics Similar to Slovenes by Poverty
In terms of poverty, the demographic groups most similar to Slovenes are Immigrants from Japan (11.0%, a difference of 0.010%), Asian (11.0%, a difference of 0.040%), Immigrants from Romania (11.0%, a difference of 0.050%), Immigrants from Czechoslovakia (11.0%, a difference of 0.060%), and Turkish (11.0%, a difference of 0.14%).
| Demographics | Rating | Rank | Poverty |
| Immigrants | Iran | 99.2 /100 | #41 | Exceptional 10.9% |
| Koreans | 99.2 /100 | #42 | Exceptional 10.9% |
| Immigrants | Singapore | 99.2 /100 | #43 | Exceptional 10.9% |
| Immigrants | Moldova | 99.1 /100 | #44 | Exceptional 10.9% |
| Turks | 98.9 /100 | #45 | Exceptional 11.0% |
| Immigrants | Czechoslovakia | 98.9 /100 | #46 | Exceptional 11.0% |
| Immigrants | Romania | 98.9 /100 | #47 | Exceptional 11.0% |
| Slovenes | 98.9 /100 | #48 | Exceptional 11.0% |
| Immigrants | Japan | 98.9 /100 | #49 | Exceptional 11.0% |
| Asians | 98.9 /100 | #50 | Exceptional 11.0% |
| Immigrants | Croatia | 98.7 /100 | #51 | Exceptional 11.0% |
| Immigrants | Philippines | 98.7 /100 | #52 | Exceptional 11.0% |
| Immigrants | Austria | 98.6 /100 | #53 | Exceptional 11.1% |
| Immigrants | Bulgaria | 98.5 /100 | #54 | Exceptional 11.1% |
| Immigrants | Serbia | 98.5 /100 | #55 | Exceptional 11.1% |
Demographics Similar to Spanish by Poverty
In terms of poverty, the demographic groups most similar to Spanish are Immigrants from Lebanon (12.8%, a difference of 0.010%), Immigrants from Kenya (12.8%, a difference of 0.19%), Iraqi (12.7%, a difference of 0.31%), Immigrants from Kuwait (12.7%, a difference of 0.33%), and Spaniard (12.8%, a difference of 0.35%).
| Demographics | Rating | Rank | Poverty |
| Sierra Leoneans | 31.5 /100 | #191 | Fair 12.6% |
| South American Indians | 23.3 /100 | #192 | Fair 12.7% |
| Delaware | 21.4 /100 | #193 | Fair 12.7% |
| Arabs | 21.1 /100 | #194 | Fair 12.7% |
| Immigrants | Kuwait | 20.9 /100 | #195 | Fair 12.7% |
| Iraqis | 20.8 /100 | #196 | Fair 12.7% |
| Immigrants | Lebanon | 18.7 /100 | #197 | Poor 12.8% |
| Spanish | 18.7 /100 | #198 | Poor 12.8% |
| Immigrants | Kenya | 17.5 /100 | #199 | Poor 12.8% |
| Spaniards | 16.5 /100 | #200 | Poor 12.8% |
| Immigrants | Uganda | 16.5 /100 | #201 | Poor 12.8% |
| Immigrants | Uruguay | 15.6 /100 | #202 | Poor 12.8% |
| Hmong | 15.0 /100 | #203 | Poor 12.8% |
| Immigrants | Western Asia | 14.1 /100 | #204 | Poor 12.9% |
| Tsimshian | 9.2 /100 | #205 | Tragic 13.0% |