Slovene vs Sioux Single Mother Poverty

COMPARE

Slovene
Race
Ancestry
AfghanAfricanAlaska NativeAlaskan AthabascanAlbanianAleutAlsatianAmericanApacheArabArapahoArgentineanArmenianAssyrian/Chaldean/SyriacAustralianAustrianBahamianBangladeshiBarbadianBasqueBelgianBelizeanBermudanBhutaneseBlackfeetBolivianBrazilianBritishBritish West IndianBulgarianBurmeseCajunCambodianCanadianCape VerdeanCarpatho RusynCelticCentral AmericanCentral American IndianCherokeeCheyenneChickasawChileanChineseChippewaChoctawColombianColvilleComancheCosta RicanCreeCreekCroatianCrowCubanCypriotCzechCzechoslovakianDanishDelawareDominicanDutchDutch West IndianEastern EuropeanEcuadorianEgyptianEnglishEstonianEthiopianEuropeanFijianFilipinoFinnishFrenchFrench American IndianFrench CanadianGermanGerman RussianGhanaianGreekGuamanian/ChamorroGuatemalanGuyaneseHaitianHmongHonduranHopiHoumaHungarianIcelanderIndian (Asian)IndonesianInupiatIranianIraqiIrishIroquoisIsraeliItalianJamaicanJapaneseJordanianKenyanKiowaKoreanLaotianLatvianLebaneseLiberianLithuanianLumbeeLuxembourgerMacedonianMalaysianMalteseMarshalleseMenomineeMexicanMexican American IndianMongolianMoroccanNative HawaiianNavajoNepaleseNew ZealanderNicaraguanNigerianNorthern EuropeanNorwegianOkinawanOsageOttawaPaiutePakistaniPalestinianPanamanianParaguayanPennsylvania GermanPeruvianPimaPolishPortuguesePotawatomiPuebloPuerto RicanPuget Sound SalishRomanianRussianSalvadoranSamoanScandinavianScotch-IrishScottishSeminoleSenegaleseSerbianShoshoneSierra LeoneanSlavicSlovakSloveneSomaliSouth AfricanSouth AmericanSouth American IndianSoviet UnionSpaniardSpanishSpanish AmericanSpanish American IndianSri LankanSubsaharan AfricanSudaneseSwedishSwissSyrianTaiwaneseThaiTlingit-HaidaTohono O'OdhamTonganTrinidadian and TobagonianTsimshianTurkishU.S. Virgin IslanderUgandanUkrainianUruguayanUteVenezuelanVietnameseWelshWest IndianYakamaYaquiYugoslavianYumanYup'ikZimbabwean
Immigration
NonimmigrantsImmigrantsAfghanistanAfricaAlbaniaArgentinaArmeniaAsiaAustraliaAustriaBahamasBangladeshBarbadosBelarusBelgiumBelizeBoliviaBosnia and HerzegovinaBrazilBulgariaBurma/MyanmarCabo VerdeCambodiaCameroonCanadaCaribbeanCentral AmericaChileChinaColombiaCongoCosta RicaCroatiaCubaCzechoslovakiaDenmarkDominicaDominican RepublicEastern AfricaEastern AsiaEastern EuropeEcuadorEgyptEl SalvadorEnglandEritreaEthiopiaEuropeFijiFranceGermanyGhanaGreeceGrenadaGuatemalaGuyanaHaitiHondurasHong KongHungaryIndiaIndonesiaIranIraqIrelandIsraelItalyJamaicaJapanJordanKazakhstanKenyaKoreaKuwaitLaosLatin AmericaLatviaLebanonLiberiaLithuaniaMalaysiaMexicoMicronesiaMiddle AfricaMoldovaMoroccoNepalNetherlandsNicaraguaNigeriaNorth AmericaNorth MacedoniaNorthern AfricaNorthern EuropeNorwayOceaniaPakistanPanamaPeruPhilippinesPolandPortugalRomaniaRussiaSaudi ArabiaScotlandSenegalSerbiaSierra LeoneSingaporeSomaliaSouth AfricaSouth AmericaSouth Central AsiaSouth Eastern AsiaSouthern EuropeSpainSri LankaSt. Vincent and the GrenadinesSudanSwedenSwitzerlandSyriaTaiwanThailandTrinidad and TobagoTurkeyUgandaUkraineUruguayUzbekistanVenezuelaVietnamWest IndiesWestern AfricaWestern AsiaWestern EuropeYemenZaireZimbabweAzores
Sioux
Race
Ancestry
AfghanAfricanAlaska NativeAlaskan AthabascanAlbanianAleutAlsatianAmericanApacheArabArapahoArgentineanArmenianAssyrian/Chaldean/SyriacAustralianAustrianBahamianBangladeshiBarbadianBasqueBelgianBelizeanBermudanBhutaneseBlackfeetBolivianBrazilianBritishBritish West IndianBulgarianBurmeseCajunCambodianCanadianCape VerdeanCarpatho RusynCelticCentral AmericanCentral American IndianCherokeeCheyenneChickasawChileanChineseChippewaChoctawColombianColvilleComancheCosta RicanCreeCreekCroatianCrowCubanCypriotCzechCzechoslovakianDanishDelawareDominicanDutchDutch West IndianEastern EuropeanEcuadorianEgyptianEnglishEstonianEthiopianEuropeanFijianFilipinoFinnishFrenchFrench American IndianFrench CanadianGermanGerman RussianGhanaianGreekGuamanian/ChamorroGuatemalanGuyaneseHaitianHmongHonduranHopiHoumaHungarianIcelanderIndian (Asian)IndonesianInupiatIranianIraqiIrishIroquoisIsraeliItalianJamaicanJapaneseJordanianKenyanKiowaKoreanLaotianLatvianLebaneseLiberianLithuanianLumbeeLuxembourgerMacedonianMalaysianMalteseMarshalleseMenomineeMexicanMexican American IndianMongolianMoroccanNative HawaiianNavajoNepaleseNew ZealanderNicaraguanNigerianNorthern EuropeanNorwegianOkinawanOsageOttawaPaiutePakistaniPalestinianPanamanianParaguayanPennsylvania GermanPeruvianPimaPolishPortuguesePotawatomiPuebloPuerto RicanPuget Sound SalishRomanianRussianSalvadoranSamoanScandinavianScotch-IrishScottishSeminoleSenegaleseSerbianShoshoneSierra LeoneanSiouxSlavicSlovakSomaliSouth AfricanSouth AmericanSouth American IndianSoviet UnionSpaniardSpanishSpanish AmericanSpanish American IndianSri LankanSubsaharan AfricanSudaneseSwedishSwissSyrianTaiwaneseThaiTlingit-HaidaTohono O'OdhamTonganTrinidadian and TobagonianTsimshianTurkishU.S. Virgin IslanderUgandanUkrainianUruguayanUteVenezuelanVietnameseWelshWest IndianYakamaYaquiYugoslavianYumanYup'ikZimbabwean
Immigration
NonimmigrantsImmigrantsAfghanistanAfricaAlbaniaArgentinaArmeniaAsiaAustraliaAustriaBahamasBangladeshBarbadosBelarusBelgiumBelizeBoliviaBosnia and HerzegovinaBrazilBulgariaBurma/MyanmarCabo VerdeCambodiaCameroonCanadaCaribbeanCentral AmericaChileChinaColombiaCongoCosta RicaCroatiaCubaCzechoslovakiaDenmarkDominicaDominican RepublicEastern AfricaEastern AsiaEastern EuropeEcuadorEgyptEl SalvadorEnglandEritreaEthiopiaEuropeFijiFranceGermanyGhanaGreeceGrenadaGuatemalaGuyanaHaitiHondurasHong KongHungaryIndiaIndonesiaIranIraqIrelandIsraelItalyJamaicaJapanJordanKazakhstanKenyaKoreaKuwaitLaosLatin AmericaLatviaLebanonLiberiaLithuaniaMalaysiaMexicoMicronesiaMiddle AfricaMoldovaMoroccoNepalNetherlandsNicaraguaNigeriaNorth AmericaNorth MacedoniaNorthern AfricaNorthern EuropeNorwayOceaniaPakistanPanamaPeruPhilippinesPolandPortugalRomaniaRussiaSaudi ArabiaScotlandSenegalSerbiaSierra LeoneSingaporeSomaliaSouth AfricaSouth AmericaSouth Central AsiaSouth Eastern AsiaSouthern EuropeSpainSri LankaSt. Vincent and the GrenadinesSudanSwedenSwitzerlandSyriaTaiwanThailandTrinidad and TobagoTurkeyUgandaUkraineUruguayUzbekistanVenezuelaVietnamWest IndiesWestern AfricaWestern AsiaWestern EuropeYemenZaireZimbabweAzores
Single Mother Poverty
Income
Poverty
Unemployment
Labor Participation
Family Structure
Vehicle Availability
Education Level
Disability

Single Mother Poverty Comparison

Slovenes

Sioux

Good
Tragic
28.8%
SINGLE MOTHER POVERTY
76.4/ 100
METRIC RATING
153rd/ 347
METRIC RANK
38.8%
SINGLE MOTHER POVERTY
0.0/ 100
METRIC RATING
340th/ 347
METRIC RANK

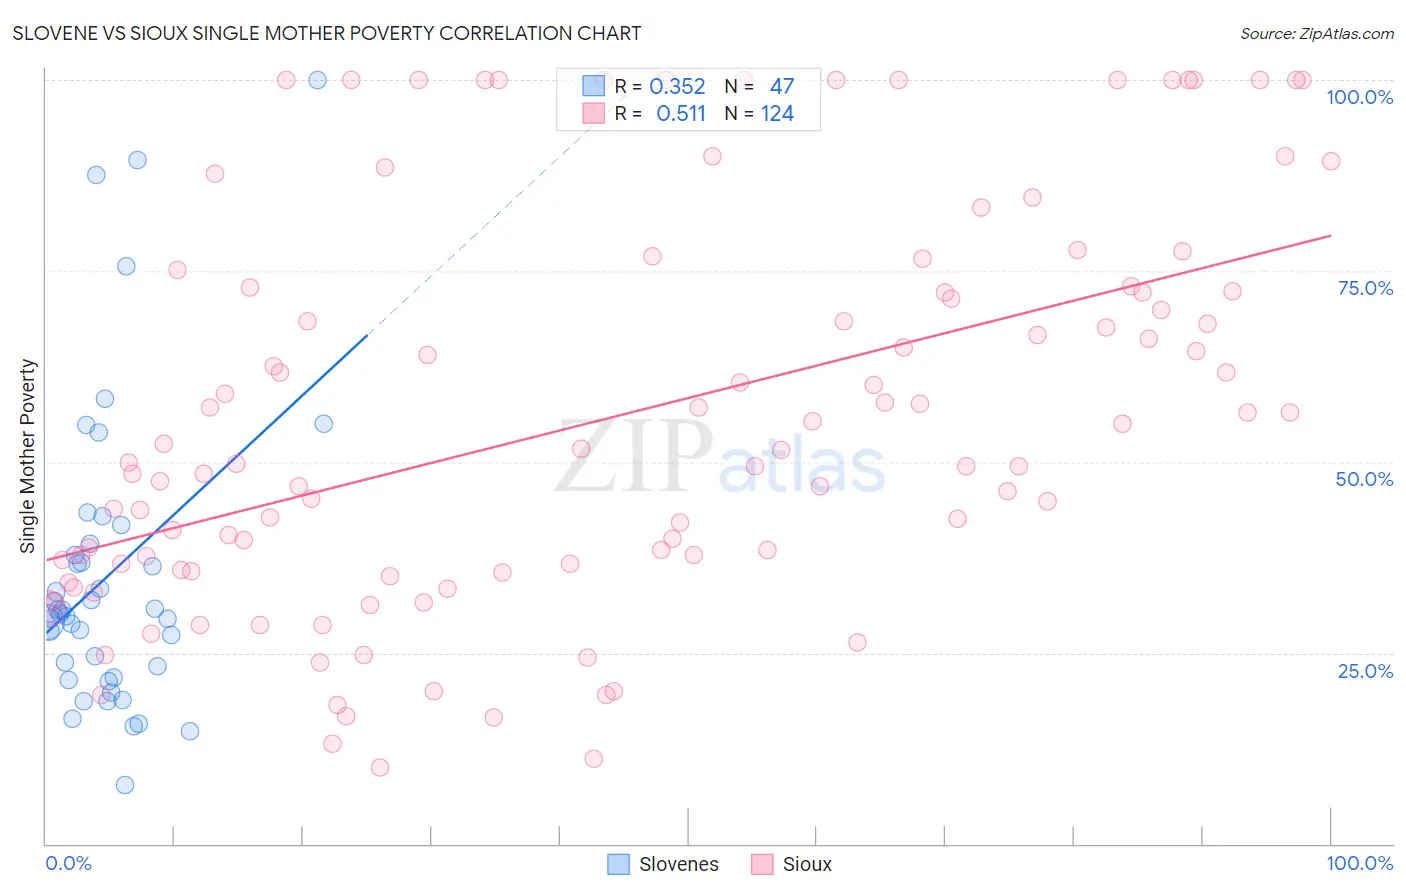
Slovene vs Sioux Single Mother Poverty Correlation Chart

The statistical analysis conducted on geographies consisting of 255,975,131 people shows a mild positive correlation between the proportion of Slovenes and poverty level among single mothers in the United States with a correlation coefficient (R) of 0.352 and weighted average of 28.8%. Similarly, the statistical analysis conducted on geographies consisting of 231,213,938 people shows a substantial positive correlation between the proportion of Sioux and poverty level among single mothers in the United States with a correlation coefficient (R) of 0.511 and weighted average of 38.8%, a difference of 34.9%.
Slovene vs Sioux Single Mother Poverty

Single Mother Poverty Correlation Summary

MeasurementSloveneSioux
Minimum7.7%10.0%
Maximum100.0%100.0%
Range92.3%90.0%
Mean35.2%55.8%
Median30.1%50.7%
Interquartile 25% (IQ1)21.7%36.2%
Interquartile 75% (IQ3)39.2%72.6%
Interquartile Range (IQR)17.5%36.4%
Standard Deviation (Sample)19.9%25.6%
Standard Deviation (Population)19.6%25.5%

Similar Demographics by Single Mother Poverty

Demographics Similar to Slovenes by Single Mother Poverty

In terms of single mother poverty, the demographic groups most similar to Slovenes are Austrian (28.7%, a difference of 0.18%), Portuguese (28.8%, a difference of 0.21%), Immigrants from Oceania (28.7%, a difference of 0.25%), Ugandan (28.8%, a difference of 0.29%), and Iraqi (28.8%, a difference of 0.31%).
DemographicsRating | RankSingle Mother Poverty
Immigrants | Denmark
86.1
/100
|
#146
Excellent
28.5%
Immigrants | Lebanon
85.3
/100
|
#147
Excellent
28.6%
Syrians
85.3
/100
|
#148
Excellent
28.6%
Serbians
85.0
/100
|
#149
Excellent
28.6%
Northern Europeans
81.7
/100
|
#150
Excellent
28.6%
Immigrants | Oceania
79.9
/100
|
#151
Good
28.7%
Austrians
79.0
/100
|
#152
Good
28.7%
Slovenes
76.4
/100
|
#153
Good
28.8%
Portuguese
73.2
/100
|
#154
Good
28.8%
Ugandans
71.7
/100
|
#155
Good
28.8%
Iraqis
71.5
/100
|
#156
Good
28.8%
Immigrants | Western Europe
71.1
/100
|
#157
Good
28.9%
Immigrants | Hungary
70.6
/100
|
#158
Good
28.9%
Czechs
68.4
/100
|
#159
Good
28.9%
Japanese
68.0
/100
|
#160
Good
28.9%

Demographics Similar to Sioux by Single Mother Poverty

In terms of single mother poverty, the demographic groups most similar to Sioux are Crow (38.6%, a difference of 0.40%), Pima (38.6%, a difference of 0.49%), Immigrants from Yemen (38.5%, a difference of 0.70%), Cheyenne (38.5%, a difference of 0.74%), and Colville (39.3%, a difference of 1.3%).
DemographicsRating | RankSingle Mother Poverty
Menominee
0.0
/100
|
#333
Tragic
37.1%
Pueblo
0.0
/100
|
#334
Tragic
37.2%
Yuman
0.0
/100
|
#335
Tragic
37.8%
Cheyenne
0.0
/100
|
#336
Tragic
38.5%
Immigrants | Yemen
0.0
/100
|
#337
Tragic
38.5%
Pima
0.0
/100
|
#338
Tragic
38.6%
Crow
0.0
/100
|
#339
Tragic
38.6%
Sioux
0.0
/100
|
#340
Tragic
38.8%
Colville
0.0
/100
|
#341
Tragic
39.3%
Navajo
0.0
/100
|
#342
Tragic
40.2%
Cajuns
0.0
/100
|
#343
Tragic
40.3%
Tohono O'odham
0.0
/100
|
#344
Tragic
43.0%
Lumbee
0.0
/100
|
#345
Tragic
43.2%
Houma
0.0
/100
|
#346
Tragic
43.5%
Puerto Ricans
0.0
/100
|
#347
Tragic
44.5%