Slovene vs Lebanese Child Poverty Under the Age of 16
COMPARE
Slovene
Lebanese
Child Poverty Under the Age of 16
Child Poverty Under the Age of 16 Comparison
Slovenes
Lebanese
14.3%
CHILD POVERTY UNDER THE AGE OF 16
98.1/ 100
METRIC RATING
66th/ 347
METRIC RANK
16.3%
CHILD POVERTY UNDER THE AGE OF 16
45.9/ 100
METRIC RATING
176th/ 347
METRIC RANK
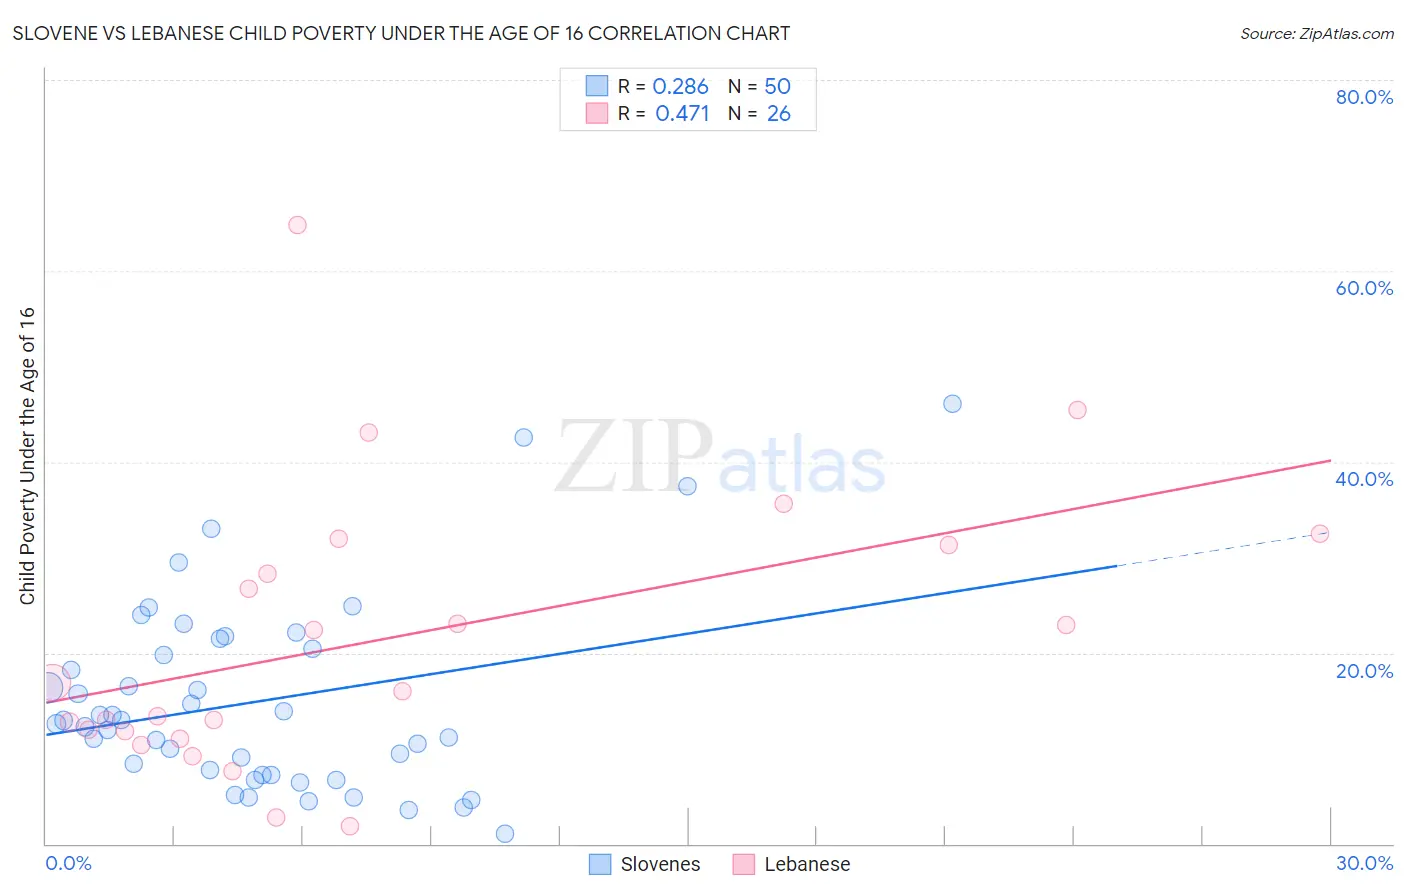
Slovene vs Lebanese Child Poverty Under the Age of 16 Correlation Chart
The statistical analysis conducted on geographies consisting of 259,334,026 people shows a weak positive correlation between the proportion of Slovenes and poverty level among children under the age of 16 in the United States with a correlation coefficient (R) of 0.286 and weighted average of 14.3%. Similarly, the statistical analysis conducted on geographies consisting of 397,248,184 people shows a moderate positive correlation between the proportion of Lebanese and poverty level among children under the age of 16 in the United States with a correlation coefficient (R) of 0.471 and weighted average of 16.3%, a difference of 14.0%.
Child Poverty Under the Age of 16 Correlation Summary
| Measurement | Slovene | Lebanese |
| Minimum | 1.00% | 1.9% |
| Maximum | 46.2% | 64.8% |
| Range | 45.2% | 63.0% |
| Mean | 14.9% | 21.5% |
| Median | 12.7% | 16.5% |
| Interquartile 25% (IQ1) | 7.2% | 11.8% |
| Interquartile 75% (IQ3) | 20.4% | 31.3% |
| Interquartile Range (IQR) | 13.2% | 19.5% |
| Standard Deviation (Sample) | 10.0% | 14.6% |
| Standard Deviation (Population) | 9.9% | 14.4% |
Similar Demographics by Child Poverty Under the Age of 16
Demographics Similar to Slovenes by Child Poverty Under the Age of 16
In terms of child poverty under the age of 16, the demographic groups most similar to Slovenes are European (14.3%, a difference of 0.030%), Laotian (14.3%, a difference of 0.14%), Immigrants from Philippines (14.3%, a difference of 0.18%), Immigrants from Bulgaria (14.3%, a difference of 0.21%), and Immigrants from Netherlands (14.3%, a difference of 0.31%).
| Demographics | Rating | Rank | Child Poverty Under the Age of 16 |
| Scandinavians | 98.6 /100 | #59 | Exceptional 14.1% |
| Immigrants | Austria | 98.5 /100 | #60 | Exceptional 14.2% |
| Immigrants | Sweden | 98.5 /100 | #61 | Exceptional 14.2% |
| Zimbabweans | 98.5 /100 | #62 | Exceptional 14.2% |
| Immigrants | Europe | 98.4 /100 | #63 | Exceptional 14.2% |
| Immigrants | Romania | 98.3 /100 | #64 | Exceptional 14.2% |
| Immigrants | Philippines | 98.2 /100 | #65 | Exceptional 14.3% |
| Slovenes | 98.1 /100 | #66 | Exceptional 14.3% |
| Europeans | 98.1 /100 | #67 | Exceptional 14.3% |
| Laotians | 98.0 /100 | #68 | Exceptional 14.3% |
| Immigrants | Bulgaria | 98.0 /100 | #69 | Exceptional 14.3% |
| Immigrants | Netherlands | 97.9 /100 | #70 | Exceptional 14.3% |
| Immigrants | Poland | 97.9 /100 | #71 | Exceptional 14.3% |
| Cambodians | 97.8 /100 | #72 | Exceptional 14.4% |
| Immigrants | Turkey | 97.6 /100 | #73 | Exceptional 14.4% |
Demographics Similar to Lebanese by Child Poverty Under the Age of 16
In terms of child poverty under the age of 16, the demographic groups most similar to Lebanese are Scotch-Irish (16.3%, a difference of 0.15%), Ethiopian (16.3%, a difference of 0.30%), Immigrants from Ethiopia (16.4%, a difference of 0.43%), Immigrants from Syria (16.4%, a difference of 0.43%), and South American Indian (16.4%, a difference of 0.49%).
| Demographics | Rating | Rank | Child Poverty Under the Age of 16 |
| Uruguayans | 54.7 /100 | #169 | Average 16.1% |
| Immigrants | Colombia | 54.4 /100 | #170 | Average 16.1% |
| Hungarians | 52.5 /100 | #171 | Average 16.2% |
| Afghans | 52.3 /100 | #172 | Average 16.2% |
| Immigrants | Saudi Arabia | 52.1 /100 | #173 | Average 16.2% |
| Whites/Caucasians | 50.0 /100 | #174 | Average 16.2% |
| Scotch-Irish | 47.1 /100 | #175 | Average 16.3% |
| Lebanese | 45.9 /100 | #176 | Average 16.3% |
| Ethiopians | 43.4 /100 | #177 | Average 16.3% |
| Immigrants | Ethiopia | 42.3 /100 | #178 | Average 16.4% |
| Immigrants | Syria | 42.3 /100 | #179 | Average 16.4% |
| South American Indians | 41.8 /100 | #180 | Average 16.4% |
| Immigrants | South America | 40.8 /100 | #181 | Average 16.4% |
| Hawaiians | 38.2 /100 | #182 | Fair 16.4% |
| Celtics | 38.2 /100 | #183 | Fair 16.4% |