Slovak vs Peruvian Poverty

COMPARE

Slovak
Race
Ancestry
AfghanAfricanAlaska NativeAlaskan AthabascanAlbanianAleutAlsatianAmericanApacheArabArapahoArgentineanArmenianAssyrian/Chaldean/SyriacAustralianAustrianBahamianBangladeshiBarbadianBasqueBelgianBelizeanBermudanBhutaneseBlackfeetBolivianBrazilianBritishBritish West IndianBulgarianBurmeseCajunCambodianCanadianCape VerdeanCarpatho RusynCelticCentral AmericanCentral American IndianCherokeeCheyenneChickasawChileanChineseChippewaChoctawColombianColvilleComancheCosta RicanCreeCreekCroatianCrowCubanCypriotCzechCzechoslovakianDanishDelawareDominicanDutchDutch West IndianEastern EuropeanEcuadorianEgyptianEnglishEstonianEthiopianEuropeanFijianFilipinoFinnishFrenchFrench American IndianFrench CanadianGermanGerman RussianGhanaianGreekGuamanian/ChamorroGuatemalanGuyaneseHaitianHmongHonduranHopiHoumaHungarianIcelanderIndian (Asian)IndonesianInupiatIranianIraqiIrishIroquoisIsraeliItalianJamaicanJapaneseJordanianKenyanKiowaKoreanLaotianLatvianLebaneseLiberianLithuanianLumbeeLuxembourgerMacedonianMalaysianMalteseMarshalleseMenomineeMexicanMexican American IndianMongolianMoroccanNative HawaiianNavajoNepaleseNew ZealanderNicaraguanNigerianNorthern EuropeanNorwegianOkinawanOsageOttawaPaiutePakistaniPalestinianPanamanianParaguayanPennsylvania GermanPimaPolishPortuguesePotawatomiPuebloPuerto RicanPuget Sound SalishRomanianRussianSalvadoranSamoanScandinavianScotch-IrishScottishSeminoleSenegaleseSerbianShoshoneSierra LeoneanSiouxSlavicSlovakSloveneSomaliSouth AfricanSouth AmericanSouth American IndianSoviet UnionSpaniardSpanishSpanish AmericanSpanish American IndianSri LankanSubsaharan AfricanSudaneseSwedishSwissSyrianTaiwaneseThaiTlingit-HaidaTohono O'OdhamTonganTrinidadian and TobagonianTsimshianTurkishU.S. Virgin IslanderUgandanUkrainianUruguayanUteVenezuelanVietnameseWelshWest IndianYakamaYaquiYugoslavianYumanYup'ikZimbabwean
Immigration
NonimmigrantsImmigrantsAfghanistanAfricaAlbaniaArgentinaArmeniaAsiaAustraliaAustriaBahamasBangladeshBarbadosBelarusBelgiumBelizeBoliviaBosnia and HerzegovinaBrazilBulgariaBurma/MyanmarCabo VerdeCambodiaCameroonCanadaCaribbeanCentral AmericaChileChinaColombiaCongoCosta RicaCroatiaCubaCzechoslovakiaDenmarkDominicaDominican RepublicEastern AfricaEastern AsiaEastern EuropeEcuadorEgyptEl SalvadorEnglandEritreaEthiopiaEuropeFijiFranceGermanyGhanaGreeceGrenadaGuatemalaGuyanaHaitiHondurasHong KongHungaryIndiaIndonesiaIranIraqIrelandIsraelItalyJamaicaJapanJordanKazakhstanKenyaKoreaKuwaitLaosLatin AmericaLatviaLebanonLiberiaLithuaniaMalaysiaMexicoMicronesiaMiddle AfricaMoldovaMoroccoNepalNetherlandsNicaraguaNigeriaNorth AmericaNorth MacedoniaNorthern AfricaNorthern EuropeNorwayOceaniaPakistanPanamaPeruPhilippinesPolandPortugalRomaniaRussiaSaudi ArabiaScotlandSenegalSerbiaSierra LeoneSingaporeSomaliaSouth AfricaSouth AmericaSouth Central AsiaSouth Eastern AsiaSouthern EuropeSpainSri LankaSt. Vincent and the GrenadinesSudanSwedenSwitzerlandSyriaTaiwanThailandTrinidad and TobagoTurkeyUgandaUkraineUruguayUzbekistanVenezuelaVietnamWest IndiesWestern AfricaWestern AsiaWestern EuropeYemenZaireZimbabweAzores
Peruvian
Race
Ancestry
AfghanAfricanAlaska NativeAlaskan AthabascanAlbanianAleutAlsatianAmericanApacheArabArapahoArgentineanArmenianAssyrian/Chaldean/SyriacAustralianAustrianBahamianBangladeshiBarbadianBasqueBelgianBelizeanBermudanBhutaneseBlackfeetBolivianBrazilianBritishBritish West IndianBulgarianBurmeseCajunCambodianCanadianCape VerdeanCarpatho RusynCelticCentral AmericanCentral American IndianCherokeeCheyenneChickasawChileanChineseChippewaChoctawColombianColvilleComancheCosta RicanCreeCreekCroatianCrowCubanCypriotCzechCzechoslovakianDanishDelawareDominicanDutchDutch West IndianEastern EuropeanEcuadorianEgyptianEnglishEstonianEthiopianEuropeanFijianFilipinoFinnishFrenchFrench American IndianFrench CanadianGermanGerman RussianGhanaianGreekGuamanian/ChamorroGuatemalanGuyaneseHaitianHmongHonduranHopiHoumaHungarianIcelanderIndian (Asian)IndonesianInupiatIranianIraqiIrishIroquoisIsraeliItalianJamaicanJapaneseJordanianKenyanKiowaKoreanLaotianLatvianLebaneseLiberianLithuanianLumbeeLuxembourgerMacedonianMalaysianMalteseMarshalleseMenomineeMexicanMexican American IndianMongolianMoroccanNative HawaiianNavajoNepaleseNew ZealanderNicaraguanNigerianNorthern EuropeanNorwegianOkinawanOsageOttawaPaiutePakistaniPalestinianPanamanianParaguayanPennsylvania GermanPeruvianPimaPolishPortuguesePotawatomiPuebloPuerto RicanPuget Sound SalishRomanianRussianSalvadoranSamoanScandinavianScotch-IrishScottishSeminoleSenegaleseSerbianShoshoneSierra LeoneanSiouxSlavicSloveneSomaliSouth AfricanSouth AmericanSouth American IndianSoviet UnionSpaniardSpanishSpanish AmericanSpanish American IndianSri LankanSubsaharan AfricanSudaneseSwedishSwissSyrianTaiwaneseThaiTlingit-HaidaTohono O'OdhamTonganTrinidadian and TobagonianTsimshianTurkishU.S. Virgin IslanderUgandanUkrainianUruguayanUteVenezuelanVietnameseWelshWest IndianYakamaYaquiYugoslavianYumanYup'ikZimbabwean
Immigration
NonimmigrantsImmigrantsAfghanistanAfricaAlbaniaArgentinaArmeniaAsiaAustraliaAustriaBahamasBangladeshBarbadosBelarusBelgiumBelizeBoliviaBosnia and HerzegovinaBrazilBulgariaBurma/MyanmarCabo VerdeCambodiaCameroonCanadaCaribbeanCentral AmericaChileChinaColombiaCongoCosta RicaCroatiaCubaCzechoslovakiaDenmarkDominicaDominican RepublicEastern AfricaEastern AsiaEastern EuropeEcuadorEgyptEl SalvadorEnglandEritreaEthiopiaEuropeFijiFranceGermanyGhanaGreeceGrenadaGuatemalaGuyanaHaitiHondurasHong KongHungaryIndiaIndonesiaIranIraqIrelandIsraelItalyJamaicaJapanJordanKazakhstanKenyaKoreaKuwaitLaosLatin AmericaLatviaLebanonLiberiaLithuaniaMalaysiaMexicoMicronesiaMiddle AfricaMoldovaMoroccoNepalNetherlandsNicaraguaNigeriaNorth AmericaNorth MacedoniaNorthern AfricaNorthern EuropeNorwayOceaniaPakistanPanamaPeruPhilippinesPolandPortugalRomaniaRussiaSaudi ArabiaScotlandSenegalSerbiaSierra LeoneSingaporeSomaliaSouth AfricaSouth AmericaSouth Central AsiaSouth Eastern AsiaSouthern EuropeSpainSri LankaSt. Vincent and the GrenadinesSudanSwedenSwitzerlandSyriaTaiwanThailandTrinidad and TobagoTurkeyUgandaUkraineUruguayUzbekistanVenezuelaVietnamWest IndiesWestern AfricaWestern AsiaWestern EuropeYemenZaireZimbabweAzores
Poverty
Income
Poverty
Unemployment
Labor Participation
Family Structure
Vehicle Availability
Education Level
Disability

Poverty Comparison

Slovaks

Peruvians

Exceptional
Excellent
11.2%
POVERTY
97.4/ 100
METRIC RATING
68th/ 347
METRIC RANK
11.8%
POVERTY
85.6/ 100
METRIC RATING
132nd/ 347
METRIC RANK

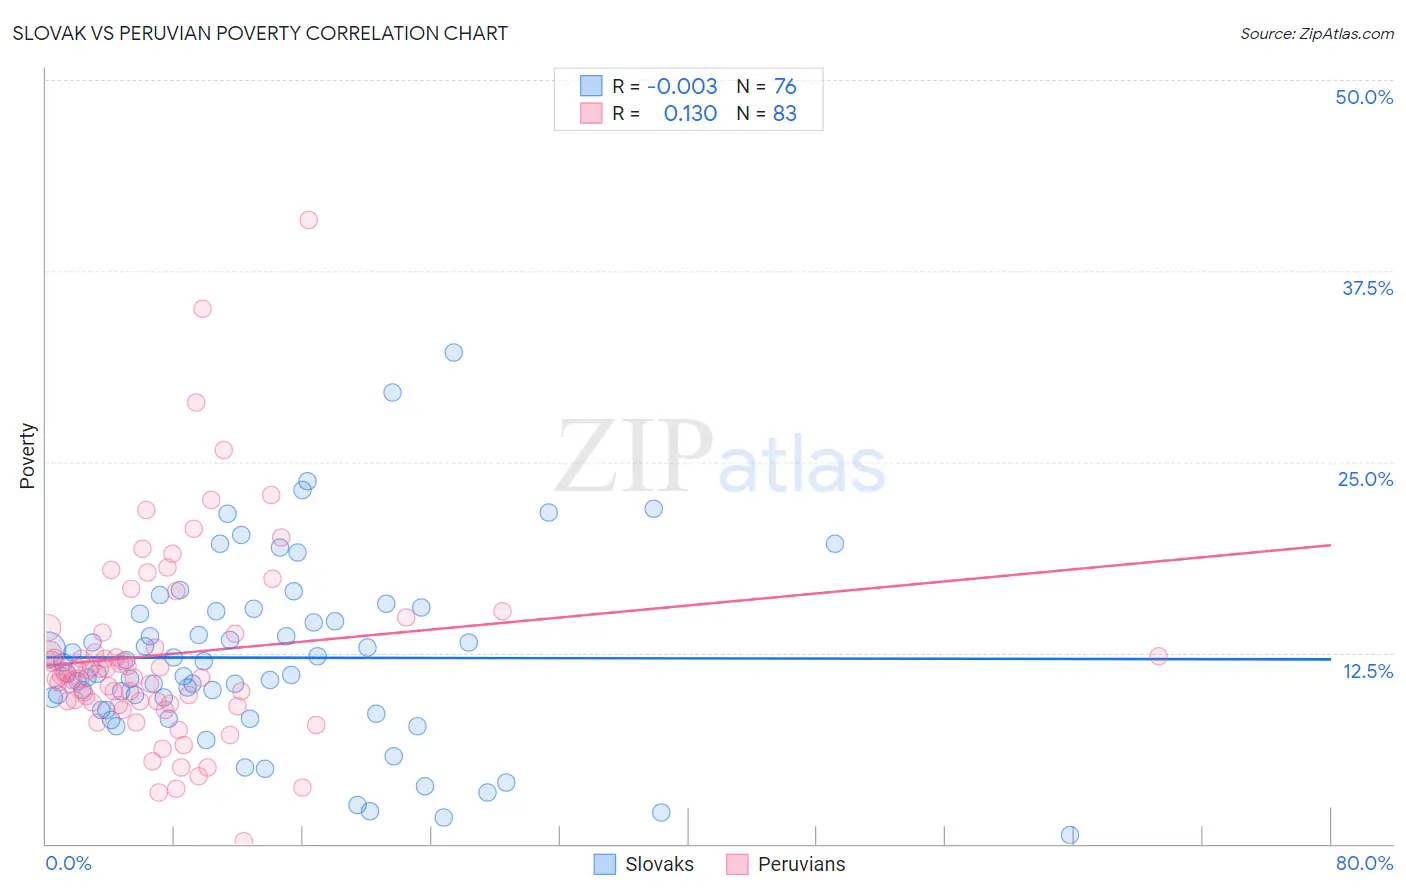
Slovak vs Peruvian Poverty Correlation Chart

The statistical analysis conducted on geographies consisting of 397,661,744 people shows no correlation between the proportion of Slovaks and poverty level in the United States with a correlation coefficient (R) of -0.003 and weighted average of 11.2%. Similarly, the statistical analysis conducted on geographies consisting of 363,001,635 people shows a poor positive correlation between the proportion of Peruvians and poverty level in the United States with a correlation coefficient (R) of 0.130 and weighted average of 11.8%, a difference of 4.9%.
Slovak vs Peruvian Poverty

Poverty Correlation Summary

MeasurementSlovakPeruvian
Minimum0.55%0.14%
Maximum32.2%40.8%
Range31.6%40.7%
Mean12.2%12.4%
Median11.1%11.2%
Interquartile 25% (IQ1)8.8%9.2%
Interquartile 75% (IQ3)15.1%13.8%
Interquartile Range (IQR)6.4%4.6%
Standard Deviation (Sample)6.1%6.5%
Standard Deviation (Population)6.0%6.4%

Similar Demographics by Poverty

Demographics Similar to Slovaks by Poverty

In terms of poverty, the demographic groups most similar to Slovaks are Immigrants from Australia (11.2%, a difference of 0.020%), Immigrants from Netherlands (11.2%, a difference of 0.060%), Serbian (11.2%, a difference of 0.060%), Immigrants from Asia (11.2%, a difference of 0.13%), and Immigrants from Canada (11.3%, a difference of 0.15%).
DemographicsRating | RankPoverty
Immigrants | Italy
97.9
/100
|
#61
Exceptional
11.2%
Austrians
97.8
/100
|
#62
Exceptional
11.2%
Ukrainians
97.8
/100
|
#63
Exceptional
11.2%
Swiss
97.7
/100
|
#64
Exceptional
11.2%
Immigrants | Asia
97.5
/100
|
#65
Exceptional
11.2%
Immigrants | Netherlands
97.5
/100
|
#66
Exceptional
11.2%
Immigrants | Australia
97.4
/100
|
#67
Exceptional
11.2%
Slovaks
97.4
/100
|
#68
Exceptional
11.2%
Serbians
97.4
/100
|
#69
Exceptional
11.2%
Immigrants | Canada
97.3
/100
|
#70
Exceptional
11.3%
Zimbabweans
97.3
/100
|
#71
Exceptional
11.3%
Europeans
97.2
/100
|
#72
Exceptional
11.3%
Immigrants | Belgium
97.2
/100
|
#73
Exceptional
11.3%
Carpatho Rusyns
97.2
/100
|
#74
Exceptional
11.3%
Immigrants | Eastern Europe
97.0
/100
|
#75
Exceptional
11.3%

Demographics Similar to Peruvians by Poverty

In terms of poverty, the demographic groups most similar to Peruvians are Immigrants from Western Europe (11.8%, a difference of 0.070%), Yugoslavian (11.8%, a difference of 0.080%), Immigrants from Vietnam (11.8%, a difference of 0.090%), French (11.8%, a difference of 0.11%), and Immigrants from Ukraine (11.8%, a difference of 0.21%).
DemographicsRating | RankPoverty
Immigrants | Brazil
88.2
/100
|
#125
Excellent
11.7%
Immigrants | Norway
88.0
/100
|
#126
Excellent
11.7%
Immigrants | Argentina
88.0
/100
|
#127
Excellent
11.7%
Immigrants | Israel
87.4
/100
|
#128
Excellent
11.7%
South Africans
87.0
/100
|
#129
Excellent
11.7%
Immigrants | Ukraine
86.6
/100
|
#130
Excellent
11.8%
French
86.1
/100
|
#131
Excellent
11.8%
Peruvians
85.6
/100
|
#132
Excellent
11.8%
Immigrants | Western Europe
85.2
/100
|
#133
Excellent
11.8%
Yugoslavians
85.2
/100
|
#134
Excellent
11.8%
Immigrants | Vietnam
85.2
/100
|
#135
Excellent
11.8%
Chileans
84.2
/100
|
#136
Excellent
11.8%
Immigrants | Switzerland
83.0
/100
|
#137
Excellent
11.8%
Immigrants | Jordan
82.4
/100
|
#138
Excellent
11.9%
Pakistanis
82.2
/100
|
#139
Excellent
11.9%