Slovak vs Immigrants from Ukraine Female Poverty Among 18-24 Year Olds

COMPARE

Slovak
Race
Ancestry
AfghanAfricanAlaska NativeAlaskan AthabascanAlbanianAleutAlsatianAmericanApacheArabArapahoArgentineanArmenianAssyrian/Chaldean/SyriacAustralianAustrianBahamianBangladeshiBarbadianBasqueBelgianBelizeanBermudanBhutaneseBlackfeetBolivianBrazilianBritishBritish West IndianBulgarianBurmeseCajunCambodianCanadianCape VerdeanCarpatho RusynCelticCentral AmericanCentral American IndianCherokeeCheyenneChickasawChileanChineseChippewaChoctawColombianColvilleComancheCosta RicanCreeCreekCroatianCrowCubanCypriotCzechCzechoslovakianDanishDelawareDominicanDutchDutch West IndianEastern EuropeanEcuadorianEgyptianEnglishEstonianEthiopianEuropeanFijianFilipinoFinnishFrenchFrench American IndianFrench CanadianGermanGerman RussianGhanaianGreekGuamanian/ChamorroGuatemalanGuyaneseHaitianHmongHonduranHopiHoumaHungarianIcelanderIndian (Asian)IndonesianInupiatIranianIraqiIrishIroquoisIsraeliItalianJamaicanJapaneseJordanianKenyanKiowaKoreanLaotianLatvianLebaneseLiberianLithuanianLumbeeLuxembourgerMacedonianMalaysianMalteseMarshalleseMenomineeMexicanMexican American IndianMongolianMoroccanNative HawaiianNavajoNepaleseNew ZealanderNicaraguanNigerianNorthern EuropeanNorwegianOkinawanOsageOttawaPaiutePakistaniPalestinianPanamanianParaguayanPennsylvania GermanPeruvianPimaPolishPortuguesePotawatomiPuebloPuerto RicanPuget Sound SalishRomanianRussianSalvadoranSamoanScandinavianScotch-IrishScottishSeminoleSenegaleseSerbianShoshoneSierra LeoneanSiouxSlavicSlovakSloveneSomaliSouth AfricanSouth AmericanSouth American IndianSoviet UnionSpaniardSpanishSpanish AmericanSpanish American IndianSri LankanSubsaharan AfricanSudaneseSwedishSwissSyrianTaiwaneseThaiTlingit-HaidaTohono O'OdhamTonganTrinidadian and TobagonianTsimshianTurkishU.S. Virgin IslanderUgandanUkrainianUruguayanUteVenezuelanVietnameseWelshWest IndianYakamaYaquiYugoslavianYumanYup'ikZimbabwean
Immigration
NonimmigrantsImmigrantsAfghanistanAfricaAlbaniaArgentinaArmeniaAsiaAustraliaAustriaBahamasBangladeshBarbadosBelarusBelgiumBelizeBoliviaBosnia and HerzegovinaBrazilBulgariaBurma/MyanmarCabo VerdeCambodiaCameroonCanadaCaribbeanCentral AmericaChileChinaColombiaCongoCosta RicaCroatiaCubaCzechoslovakiaDenmarkDominicaDominican RepublicEastern AfricaEastern AsiaEastern EuropeEcuadorEgyptEl SalvadorEnglandEritreaEthiopiaEuropeFijiFranceGermanyGhanaGreeceGrenadaGuatemalaGuyanaHaitiHondurasHong KongHungaryIndiaIndonesiaIranIraqIrelandIsraelItalyJamaicaJapanJordanKazakhstanKenyaKoreaKuwaitLaosLatin AmericaLatviaLebanonLiberiaLithuaniaMalaysiaMexicoMicronesiaMiddle AfricaMoldovaMoroccoNepalNetherlandsNicaraguaNigeriaNorth AmericaNorth MacedoniaNorthern AfricaNorthern EuropeNorwayOceaniaPakistanPanamaPeruPhilippinesPolandPortugalRomaniaRussiaSaudi ArabiaScotlandSenegalSerbiaSierra LeoneSingaporeSomaliaSouth AfricaSouth AmericaSouth Central AsiaSouth Eastern AsiaSouthern EuropeSpainSri LankaSt. Vincent and the GrenadinesSudanSwedenSwitzerlandSyriaTaiwanThailandTrinidad and TobagoTurkeyUgandaUruguayUzbekistanVenezuelaVietnamWest IndiesWestern AfricaWestern AsiaWestern EuropeYemenZaireZimbabweAzores
Immigrants from Ukraine
Race
Ancestry
AfghanAfricanAlaska NativeAlaskan AthabascanAlbanianAleutAlsatianAmericanApacheArabArapahoArgentineanArmenianAssyrian/Chaldean/SyriacAustralianAustrianBahamianBangladeshiBarbadianBasqueBelgianBelizeanBermudanBhutaneseBlackfeetBolivianBrazilianBritishBritish West IndianBulgarianBurmeseCajunCambodianCanadianCape VerdeanCarpatho RusynCelticCentral AmericanCentral American IndianCherokeeCheyenneChickasawChileanChineseChippewaChoctawColombianColvilleComancheCosta RicanCreeCreekCroatianCrowCubanCypriotCzechCzechoslovakianDanishDelawareDominicanDutchDutch West IndianEastern EuropeanEcuadorianEgyptianEnglishEstonianEthiopianEuropeanFijianFilipinoFinnishFrenchFrench American IndianFrench CanadianGermanGerman RussianGhanaianGreekGuamanian/ChamorroGuatemalanGuyaneseHaitianHmongHonduranHopiHoumaHungarianIcelanderIndian (Asian)IndonesianInupiatIranianIraqiIrishIroquoisIsraeliItalianJamaicanJapaneseJordanianKenyanKiowaKoreanLaotianLatvianLebaneseLiberianLithuanianLumbeeLuxembourgerMacedonianMalaysianMalteseMarshalleseMenomineeMexicanMexican American IndianMongolianMoroccanNative HawaiianNavajoNepaleseNew ZealanderNicaraguanNigerianNorthern EuropeanNorwegianOkinawanOsageOttawaPaiutePakistaniPalestinianPanamanianParaguayanPennsylvania GermanPeruvianPimaPolishPortuguesePotawatomiPuebloPuerto RicanPuget Sound SalishRomanianRussianSalvadoranSamoanScandinavianScotch-IrishScottishSeminoleSenegaleseSerbianShoshoneSierra LeoneanSiouxSlavicSloveneSomaliSouth AfricanSouth AmericanSouth American IndianSoviet UnionSpaniardSpanishSpanish AmericanSpanish American IndianSri LankanSubsaharan AfricanSudaneseSwedishSwissSyrianTaiwaneseThaiTlingit-HaidaTohono O'OdhamTonganTrinidadian and TobagonianTsimshianTurkishU.S. Virgin IslanderUgandanUkrainianUruguayanUteVenezuelanVietnameseWelshWest IndianYakamaYaquiYugoslavianYumanYup'ikZimbabwean
Immigration
NonimmigrantsImmigrantsAfghanistanAfricaAlbaniaArgentinaArmeniaAsiaAustraliaAustriaBahamasBangladeshBarbadosBelarusBelgiumBelizeBoliviaBosnia and HerzegovinaBrazilBulgariaBurma/MyanmarCabo VerdeCambodiaCameroonCanadaCaribbeanCentral AmericaChileChinaColombiaCongoCosta RicaCroatiaCubaCzechoslovakiaDenmarkDominicaDominican RepublicEastern AfricaEastern AsiaEastern EuropeEcuadorEgyptEl SalvadorEnglandEritreaEthiopiaEuropeFijiFranceGermanyGhanaGreeceGrenadaGuatemalaGuyanaHaitiHondurasHong KongHungaryIndiaIndonesiaIranIraqIrelandIsraelItalyJamaicaJapanJordanKazakhstanKenyaKoreaKuwaitLaosLatin AmericaLatviaLebanonLiberiaLithuaniaMalaysiaMexicoMicronesiaMiddle AfricaMoldovaMoroccoNepalNetherlandsNicaraguaNigeriaNorth AmericaNorth MacedoniaNorthern AfricaNorthern EuropeNorwayOceaniaPakistanPanamaPeruPhilippinesPolandPortugalRomaniaRussiaSaudi ArabiaScotlandSenegalSerbiaSierra LeoneSingaporeSomaliaSouth AfricaSouth AmericaSouth Central AsiaSouth Eastern AsiaSouthern EuropeSpainSri LankaSt. Vincent and the GrenadinesSudanSwedenSwitzerlandSyriaTaiwanThailandTrinidad and TobagoTurkeyUgandaUkraineUruguayUzbekistanVenezuelaVietnamWest IndiesWestern AfricaWestern AsiaWestern EuropeYemenZaireZimbabweAzores
Female Poverty Among 18-24 Year Olds
Income
Poverty
Unemployment
Labor Participation
Family Structure
Vehicle Availability
Education Level
Disability

Female Poverty Among 18-24 Year Olds Comparison

Slovaks

Immigrants from Ukraine

Exceptional
Exceptional
19.5%
FEMALE POVERTY AMONG 18-24 YEAR OLDS
92.9/ 100
METRIC RATING
128th/ 347
METRIC RANK
18.4%
FEMALE POVERTY AMONG 18-24 YEAR OLDS
99.9/ 100
METRIC RATING
58th/ 347
METRIC RANK

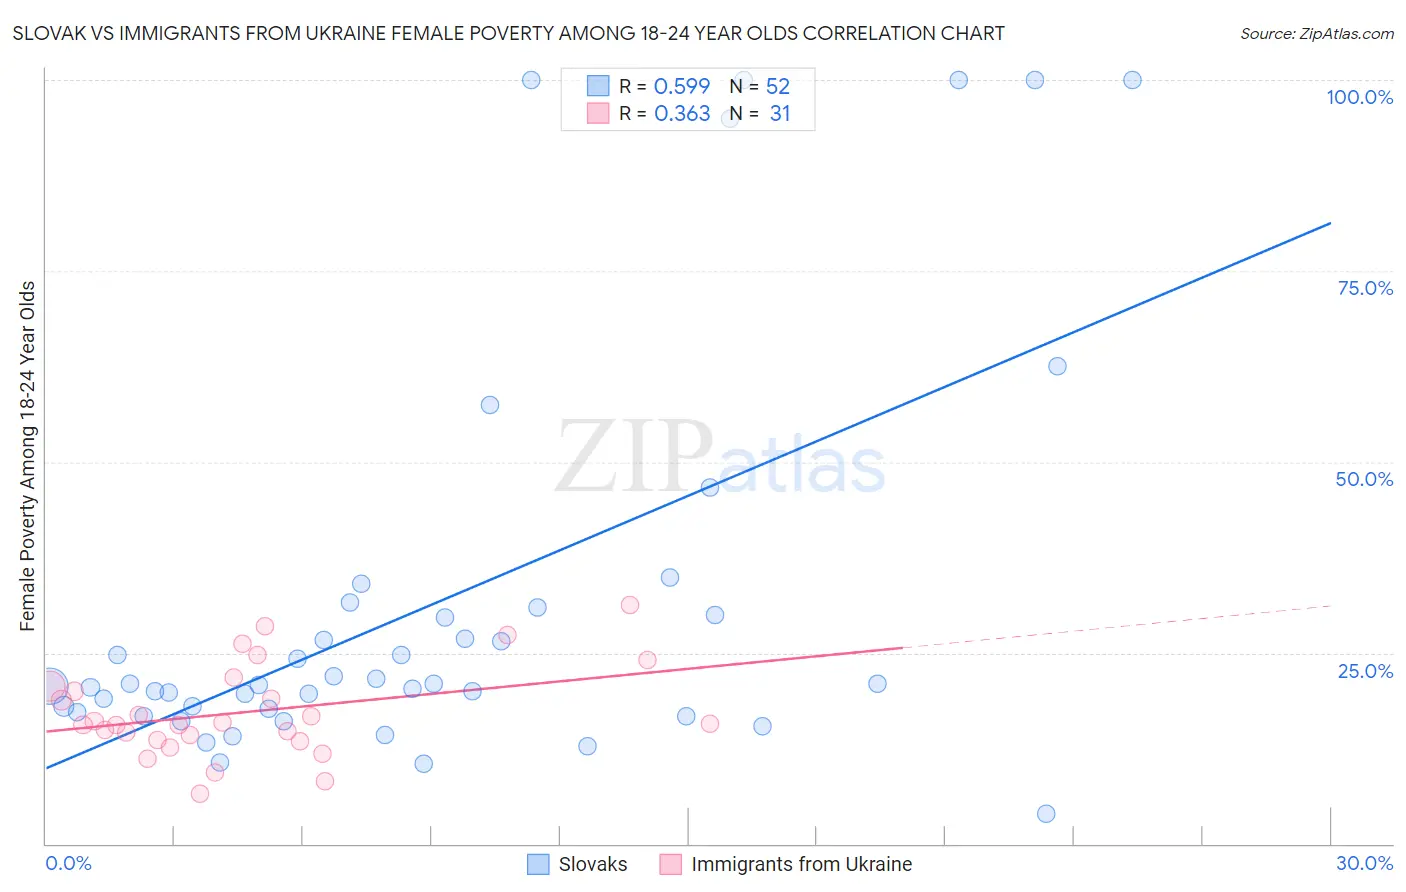
Slovak vs Immigrants from Ukraine Female Poverty Among 18-24 Year Olds Correlation Chart

The statistical analysis conducted on geographies consisting of 383,670,122 people shows a substantial positive correlation between the proportion of Slovaks and poverty level among females between the ages 18 and 24 in the United States with a correlation coefficient (R) of 0.599 and weighted average of 19.5%. Similarly, the statistical analysis conducted on geographies consisting of 283,428,309 people shows a mild positive correlation between the proportion of Immigrants from Ukraine and poverty level among females between the ages 18 and 24 in the United States with a correlation coefficient (R) of 0.363 and weighted average of 18.4%, a difference of 5.8%.
Slovak vs Immigrants from Ukraine Female Poverty Among 18-24 Year Olds

Female Poverty Among 18-24 Year Olds Correlation Summary

MeasurementSlovakImmigrants from Ukraine
Minimum3.9%6.6%
Maximum100.0%31.3%
Range96.1%24.7%
Mean31.6%17.3%
Median20.9%15.7%
Interquartile 25% (IQ1)17.5%13.7%
Interquartile 75% (IQ3)30.5%20.6%
Interquartile Range (IQR)13.0%6.9%
Standard Deviation (Sample)26.7%6.0%
Standard Deviation (Population)26.4%5.9%

Similar Demographics by Female Poverty Among 18-24 Year Olds

Demographics Similar to Slovaks by Female Poverty Among 18-24 Year Olds

In terms of female poverty among 18-24 year olds, the demographic groups most similar to Slovaks are Immigrants from England (19.5%, a difference of 0.0%), Immigrants from Canada (19.5%, a difference of 0.010%), Latvian (19.5%, a difference of 0.040%), Cape Verdean (19.4%, a difference of 0.13%), and Immigrants from Russia (19.4%, a difference of 0.15%).
DemographicsRating | RankFemale Poverty Among 18-24 Year Olds
Guyanese
95.3
/100
|
#121
Exceptional
19.4%
Cambodians
94.6
/100
|
#122
Exceptional
19.4%
Paraguayans
94.6
/100
|
#123
Exceptional
19.4%
Immigrants | Chile
94.3
/100
|
#124
Exceptional
19.4%
Immigrants | Panama
94.0
/100
|
#125
Exceptional
19.4%
Immigrants | Russia
93.7
/100
|
#126
Exceptional
19.4%
Cape Verdeans
93.6
/100
|
#127
Exceptional
19.4%
Slovaks
92.9
/100
|
#128
Exceptional
19.5%
Immigrants | England
92.9
/100
|
#129
Exceptional
19.5%
Immigrants | Canada
92.9
/100
|
#130
Exceptional
19.5%
Latvians
92.7
/100
|
#131
Exceptional
19.5%
Jamaicans
92.1
/100
|
#132
Exceptional
19.5%
Turks
92.1
/100
|
#133
Exceptional
19.5%
Immigrants | North America
92.1
/100
|
#134
Exceptional
19.5%
Soviet Union
92.0
/100
|
#135
Exceptional
19.5%

Demographics Similar to Immigrants from Ukraine by Female Poverty Among 18-24 Year Olds

In terms of female poverty among 18-24 year olds, the demographic groups most similar to Immigrants from Ukraine are Immigrants from Italy (18.4%, a difference of 0.060%), Argentinean (18.4%, a difference of 0.16%), Albanian (18.4%, a difference of 0.18%), Immigrants from Egypt (18.4%, a difference of 0.19%), and Egyptian (18.5%, a difference of 0.29%).
DemographicsRating | RankFemale Poverty Among 18-24 Year Olds
Immigrants | Eastern Europe
99.9
/100
|
#51
Exceptional
18.2%
Immigrants | Ireland
99.9
/100
|
#52
Exceptional
18.3%
Italians
99.9
/100
|
#53
Exceptional
18.3%
Immigrants | Egypt
99.9
/100
|
#54
Exceptional
18.4%
Albanians
99.9
/100
|
#55
Exceptional
18.4%
Argentineans
99.9
/100
|
#56
Exceptional
18.4%
Immigrants | Italy
99.9
/100
|
#57
Exceptional
18.4%
Immigrants | Ukraine
99.9
/100
|
#58
Exceptional
18.4%
Egyptians
99.9
/100
|
#59
Exceptional
18.5%
Immigrants | Brazil
99.8
/100
|
#60
Exceptional
18.5%
Immigrants | Albania
99.8
/100
|
#61
Exceptional
18.5%
Greeks
99.8
/100
|
#62
Exceptional
18.5%
Immigrants | Belarus
99.8
/100
|
#63
Exceptional
18.5%
Immigrants | Asia
99.8
/100
|
#64
Exceptional
18.6%
Immigrants | Scotland
99.8
/100
|
#65
Exceptional
18.6%