Slavic vs Immigrants from South Eastern Asia Female Poverty Among 25-34 Year Olds
COMPARE
Slavic
Immigrants from South Eastern Asia
Female Poverty Among 25-34 Year Olds
Female Poverty Among 25-34 Year Olds Comparison
Slavs
Immigrants from South Eastern Asia
13.2%
FEMALE POVERTY AMONG 25-34 YEAR OLDS
75.7/ 100
METRIC RATING
152nd/ 347
METRIC RANK
12.5%
FEMALE POVERTY AMONG 25-34 YEAR OLDS
97.6/ 100
METRIC RATING
85th/ 347
METRIC RANK
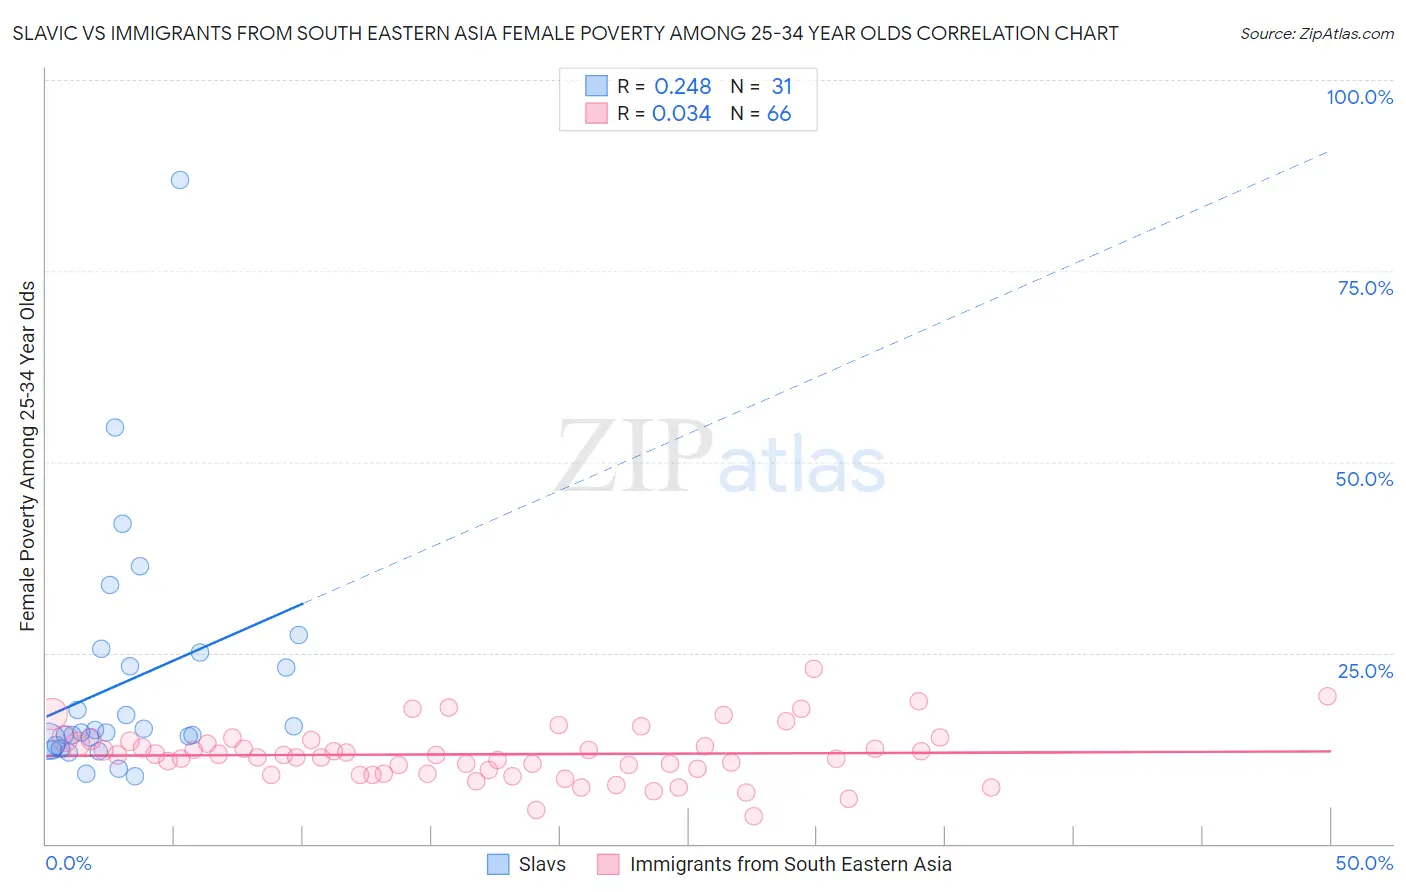
Slavic vs Immigrants from South Eastern Asia Female Poverty Among 25-34 Year Olds Correlation Chart
The statistical analysis conducted on geographies consisting of 266,820,007 people shows a weak positive correlation between the proportion of Slavs and poverty level among females between the ages 25 and 34 in the United States with a correlation coefficient (R) of 0.248 and weighted average of 13.2%. Similarly, the statistical analysis conducted on geographies consisting of 499,745,803 people shows no correlation between the proportion of Immigrants from South Eastern Asia and poverty level among females between the ages 25 and 34 in the United States with a correlation coefficient (R) of 0.034 and weighted average of 12.5%, a difference of 5.7%.
Female Poverty Among 25-34 Year Olds Correlation Summary
| Measurement | Slavic | Immigrants from South Eastern Asia |
| Minimum | 8.9% | 3.6% |
| Maximum | 87.0% | 23.0% |
| Range | 78.1% | 19.4% |
| Mean | 21.3% | 11.7% |
| Median | 14.5% | 11.6% |
| Interquartile 25% (IQ1) | 12.9% | 9.2% |
| Interquartile 75% (IQ3) | 25.0% | 13.4% |
| Interquartile Range (IQR) | 12.1% | 4.2% |
| Standard Deviation (Sample) | 16.0% | 3.6% |
| Standard Deviation (Population) | 15.8% | 3.6% |
Similar Demographics by Female Poverty Among 25-34 Year Olds
Demographics Similar to Slavs by Female Poverty Among 25-34 Year Olds
In terms of female poverty among 25-34 year olds, the demographic groups most similar to Slavs are Costa Rican (13.2%, a difference of 0.010%), Iraqi (13.2%, a difference of 0.040%), Sierra Leonean (13.2%, a difference of 0.060%), European (13.2%, a difference of 0.13%), and Lebanese (13.2%, a difference of 0.13%).
| Demographics | Rating | Rank | Female Poverty Among 25-34 Year Olds |
| Colombians | 77.2 /100 | #145 | Good 13.2% |
| South Americans | 76.9 /100 | #146 | Good 13.2% |
| Europeans | 76.8 /100 | #147 | Good 13.2% |
| Lebanese | 76.8 /100 | #148 | Good 13.2% |
| Sierra Leoneans | 76.3 /100 | #149 | Good 13.2% |
| Iraqis | 76.0 /100 | #150 | Good 13.2% |
| Costa Ricans | 75.8 /100 | #151 | Good 13.2% |
| Slavs | 75.7 /100 | #152 | Good 13.2% |
| Northern Europeans | 73.7 /100 | #153 | Good 13.2% |
| Arabs | 73.5 /100 | #154 | Good 13.2% |
| Immigrants | Sierra Leone | 72.9 /100 | #155 | Good 13.3% |
| Immigrants | Cameroon | 72.0 /100 | #156 | Good 13.3% |
| Immigrants | Western Europe | 70.3 /100 | #157 | Good 13.3% |
| Immigrants | Colombia | 69.2 /100 | #158 | Good 13.3% |
| Uruguayans | 66.9 /100 | #159 | Good 13.3% |
Demographics Similar to Immigrants from South Eastern Asia by Female Poverty Among 25-34 Year Olds
In terms of female poverty among 25-34 year olds, the demographic groups most similar to Immigrants from South Eastern Asia are Croatian (12.5%, a difference of 0.010%), Argentinean (12.5%, a difference of 0.040%), Immigrants from Latvia (12.5%, a difference of 0.11%), Immigrants from Austria (12.5%, a difference of 0.11%), and Albanian (12.5%, a difference of 0.17%).
| Demographics | Rating | Rank | Female Poverty Among 25-34 Year Olds |
| Immigrants | Ukraine | 98.6 /100 | #78 | Exceptional 12.3% |
| Immigrants | Jordan | 98.5 /100 | #79 | Exceptional 12.4% |
| Immigrants | Malaysia | 98.3 /100 | #80 | Exceptional 12.4% |
| Immigrants | Kazakhstan | 98.1 /100 | #81 | Exceptional 12.4% |
| Ethiopians | 98.0 /100 | #82 | Exceptional 12.4% |
| Albanians | 97.7 /100 | #83 | Exceptional 12.5% |
| Immigrants | Latvia | 97.7 /100 | #84 | Exceptional 12.5% |
| Immigrants | South Eastern Asia | 97.6 /100 | #85 | Exceptional 12.5% |
| Croatians | 97.5 /100 | #86 | Exceptional 12.5% |
| Argentineans | 97.5 /100 | #87 | Exceptional 12.5% |
| Immigrants | Austria | 97.4 /100 | #88 | Exceptional 12.5% |
| Italians | 97.2 /100 | #89 | Exceptional 12.5% |
| Immigrants | Albania | 97.1 /100 | #90 | Exceptional 12.5% |
| Norwegians | 96.9 /100 | #91 | Exceptional 12.6% |
| Immigrants | Armenia | 96.9 /100 | #92 | Exceptional 12.6% |