Slavic vs Immigrants from South America Family Poverty

COMPARE

Slavic
Race
Ancestry
AfghanAfricanAlaska NativeAlaskan AthabascanAlbanianAleutAlsatianAmericanApacheArabArapahoArgentineanArmenianAssyrian/Chaldean/SyriacAustralianAustrianBahamianBangladeshiBarbadianBasqueBelgianBelizeanBermudanBhutaneseBlackfeetBolivianBrazilianBritishBritish West IndianBulgarianBurmeseCajunCambodianCanadianCape VerdeanCarpatho RusynCelticCentral AmericanCentral American IndianCherokeeCheyenneChickasawChileanChineseChippewaChoctawColombianColvilleComancheCosta RicanCreeCreekCroatianCrowCubanCypriotCzechCzechoslovakianDanishDelawareDominicanDutchDutch West IndianEastern EuropeanEcuadorianEgyptianEnglishEstonianEthiopianEuropeanFijianFilipinoFinnishFrenchFrench American IndianFrench CanadianGermanGerman RussianGhanaianGreekGuamanian/ChamorroGuatemalanGuyaneseHaitianHmongHonduranHopiHoumaHungarianIcelanderIndian (Asian)IndonesianInupiatIranianIraqiIrishIroquoisIsraeliItalianJamaicanJapaneseJordanianKenyanKiowaKoreanLaotianLatvianLebaneseLiberianLithuanianLumbeeLuxembourgerMacedonianMalaysianMalteseMarshalleseMenomineeMexicanMexican American IndianMongolianMoroccanNative HawaiianNavajoNepaleseNew ZealanderNicaraguanNigerianNorthern EuropeanNorwegianOkinawanOsageOttawaPaiutePakistaniPalestinianPanamanianParaguayanPennsylvania GermanPeruvianPimaPolishPortuguesePotawatomiPuebloPuerto RicanPuget Sound SalishRomanianRussianSalvadoranSamoanScandinavianScotch-IrishScottishSeminoleSenegaleseSerbianShoshoneSierra LeoneanSiouxSlavicSlovakSloveneSomaliSouth AfricanSouth AmericanSouth American IndianSoviet UnionSpaniardSpanishSpanish AmericanSpanish American IndianSri LankanSubsaharan AfricanSudaneseSwedishSwissSyrianTaiwaneseThaiTlingit-HaidaTohono O'OdhamTonganTrinidadian and TobagonianTsimshianTurkishU.S. Virgin IslanderUgandanUkrainianUruguayanUteVenezuelanVietnameseWelshWest IndianYakamaYaquiYugoslavianYumanYup'ikZimbabwean
Immigration
NonimmigrantsImmigrantsAfghanistanAfricaAlbaniaArgentinaArmeniaAsiaAustraliaAustriaBahamasBangladeshBarbadosBelarusBelgiumBelizeBoliviaBosnia and HerzegovinaBrazilBulgariaBurma/MyanmarCabo VerdeCambodiaCameroonCanadaCaribbeanCentral AmericaChileChinaColombiaCongoCosta RicaCroatiaCubaCzechoslovakiaDenmarkDominicaDominican RepublicEastern AfricaEastern AsiaEastern EuropeEcuadorEgyptEl SalvadorEnglandEritreaEthiopiaEuropeFijiFranceGermanyGhanaGreeceGrenadaGuatemalaGuyanaHaitiHondurasHong KongHungaryIndiaIndonesiaIranIraqIrelandIsraelItalyJamaicaJapanJordanKazakhstanKenyaKoreaKuwaitLaosLatin AmericaLatviaLebanonLiberiaLithuaniaMalaysiaMexicoMicronesiaMiddle AfricaMoldovaMoroccoNepalNetherlandsNicaraguaNigeriaNorth AmericaNorth MacedoniaNorthern AfricaNorthern EuropeNorwayOceaniaPakistanPanamaPeruPhilippinesPolandPortugalRomaniaRussiaSaudi ArabiaScotlandSenegalSerbiaSierra LeoneSingaporeSomaliaSouth AfricaSouth Central AsiaSouth Eastern AsiaSouthern EuropeSpainSri LankaSt. Vincent and the GrenadinesSudanSwedenSwitzerlandSyriaTaiwanThailandTrinidad and TobagoTurkeyUgandaUkraineUruguayUzbekistanVenezuelaVietnamWest IndiesWestern AfricaWestern AsiaWestern EuropeYemenZaireZimbabweAzores
Immigrants from South America
Race
Ancestry
AfghanAfricanAlaska NativeAlaskan AthabascanAlbanianAleutAlsatianAmericanApacheArabArapahoArgentineanArmenianAssyrian/Chaldean/SyriacAustralianAustrianBahamianBangladeshiBarbadianBasqueBelgianBelizeanBermudanBhutaneseBlackfeetBolivianBrazilianBritishBritish West IndianBulgarianBurmeseCajunCambodianCanadianCape VerdeanCarpatho RusynCelticCentral AmericanCentral American IndianCherokeeCheyenneChickasawChileanChineseChippewaChoctawColombianColvilleComancheCosta RicanCreeCreekCroatianCrowCubanCypriotCzechCzechoslovakianDanishDelawareDominicanDutchDutch West IndianEastern EuropeanEcuadorianEgyptianEnglishEstonianEthiopianEuropeanFijianFilipinoFinnishFrenchFrench American IndianFrench CanadianGermanGerman RussianGhanaianGreekGuamanian/ChamorroGuatemalanGuyaneseHaitianHmongHonduranHopiHoumaHungarianIcelanderIndian (Asian)IndonesianInupiatIranianIraqiIrishIroquoisIsraeliItalianJamaicanJapaneseJordanianKenyanKiowaKoreanLaotianLatvianLebaneseLiberianLithuanianLumbeeLuxembourgerMacedonianMalaysianMalteseMarshalleseMenomineeMexicanMexican American IndianMongolianMoroccanNative HawaiianNavajoNepaleseNew ZealanderNicaraguanNigerianNorthern EuropeanNorwegianOkinawanOsageOttawaPaiutePakistaniPalestinianPanamanianParaguayanPennsylvania GermanPeruvianPimaPolishPortuguesePotawatomiPuebloPuerto RicanPuget Sound SalishRomanianRussianSalvadoranSamoanScandinavianScotch-IrishScottishSeminoleSenegaleseSerbianShoshoneSierra LeoneanSiouxSlovakSloveneSomaliSouth AfricanSouth AmericanSouth American IndianSoviet UnionSpaniardSpanishSpanish AmericanSpanish American IndianSri LankanSubsaharan AfricanSudaneseSwedishSwissSyrianTaiwaneseThaiTlingit-HaidaTohono O'OdhamTonganTrinidadian and TobagonianTsimshianTurkishU.S. Virgin IslanderUgandanUkrainianUruguayanUteVenezuelanVietnameseWelshWest IndianYakamaYaquiYugoslavianYumanYup'ikZimbabwean
Immigration
NonimmigrantsImmigrantsAfghanistanAfricaAlbaniaArgentinaArmeniaAsiaAustraliaAustriaBahamasBangladeshBarbadosBelarusBelgiumBelizeBoliviaBosnia and HerzegovinaBrazilBulgariaBurma/MyanmarCabo VerdeCambodiaCameroonCanadaCaribbeanCentral AmericaChileChinaColombiaCongoCosta RicaCroatiaCubaCzechoslovakiaDenmarkDominicaDominican RepublicEastern AfricaEastern AsiaEastern EuropeEcuadorEgyptEl SalvadorEnglandEritreaEthiopiaEuropeFijiFranceGermanyGhanaGreeceGrenadaGuatemalaGuyanaHaitiHondurasHong KongHungaryIndiaIndonesiaIranIraqIrelandIsraelItalyJamaicaJapanJordanKazakhstanKenyaKoreaKuwaitLaosLatin AmericaLatviaLebanonLiberiaLithuaniaMalaysiaMexicoMicronesiaMiddle AfricaMoldovaMoroccoNepalNetherlandsNicaraguaNigeriaNorth AmericaNorth MacedoniaNorthern AfricaNorthern EuropeNorwayOceaniaPakistanPanamaPeruPhilippinesPolandPortugalRomaniaRussiaSaudi ArabiaScotlandSenegalSerbiaSierra LeoneSingaporeSomaliaSouth AfricaSouth AmericaSouth Central AsiaSouth Eastern AsiaSouthern EuropeSpainSri LankaSt. Vincent and the GrenadinesSudanSwedenSwitzerlandSyriaTaiwanThailandTrinidad and TobagoTurkeyUgandaUkraineUruguayUzbekistanVenezuelaVietnamWest IndiesWestern AfricaWestern AsiaWestern EuropeYemenZaireZimbabweAzores
Family Poverty
Income
Poverty
Unemployment
Labor Participation
Family Structure
Vehicle Availability
Education Level
Disability

Family Poverty Comparison

Slavs

Immigrants from South America

Exceptional
Poor
8.1%
FAMILY POVERTY
95.6/ 100
METRIC RATING
104th/ 347
METRIC RANK
9.5%
FAMILY POVERTY
18.0/ 100
METRIC RATING
206th/ 347
METRIC RANK

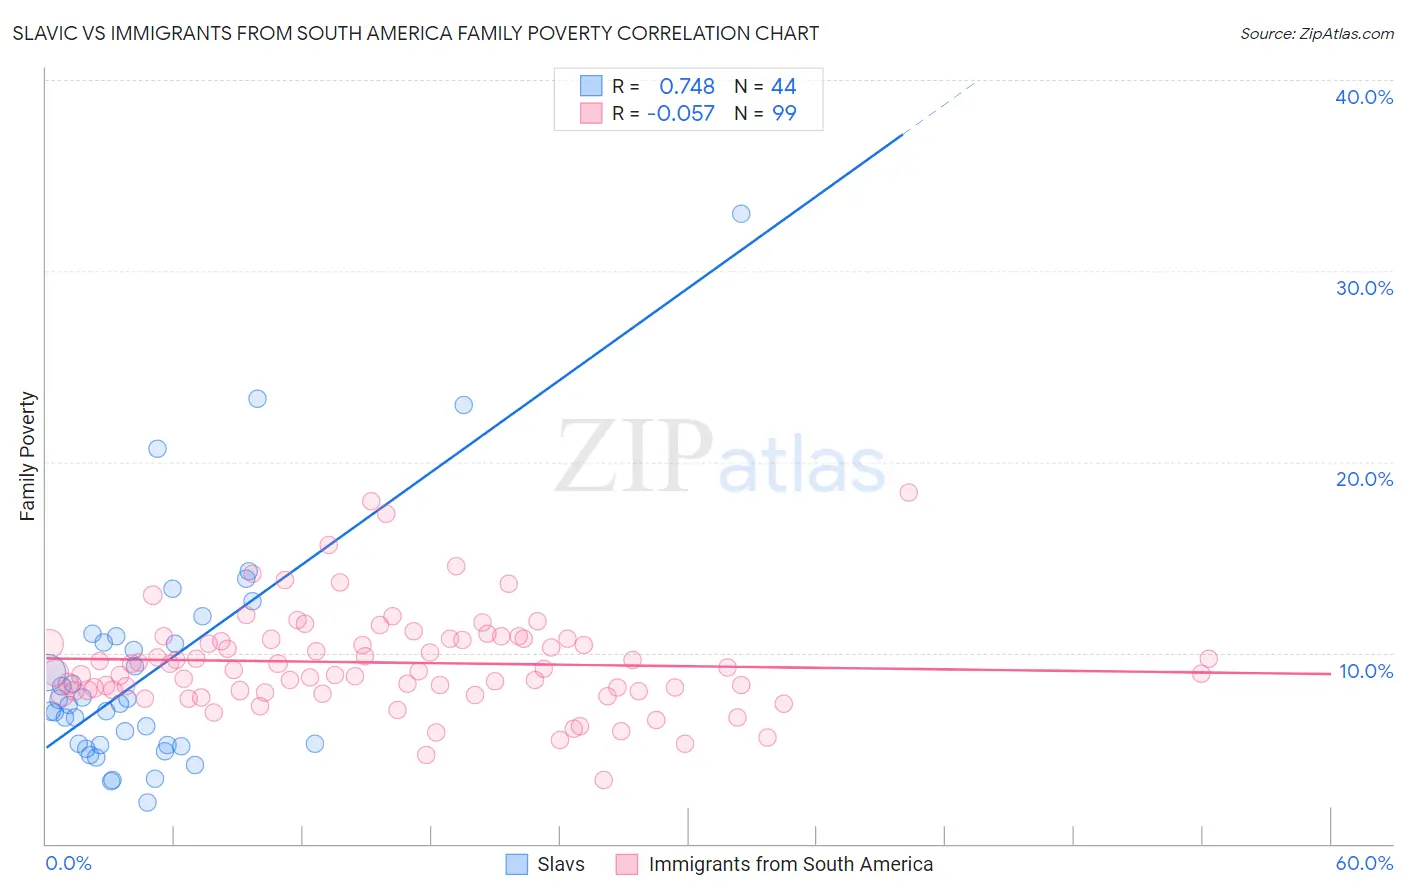
Slavic vs Immigrants from South America Family Poverty Correlation Chart

The statistical analysis conducted on geographies consisting of 270,374,378 people shows a strong positive correlation between the proportion of Slavs and poverty level among families in the United States with a correlation coefficient (R) of 0.748 and weighted average of 8.1%. Similarly, the statistical analysis conducted on geographies consisting of 484,267,691 people shows a slight negative correlation between the proportion of Immigrants from South America and poverty level among families in the United States with a correlation coefficient (R) of -0.057 and weighted average of 9.5%, a difference of 16.7%.
Slavic vs Immigrants from South America Family Poverty

Family Poverty Correlation Summary

MeasurementSlavicImmigrants from South America
Minimum2.2%3.3%
Maximum33.0%18.4%
Range30.8%15.1%
Mean9.1%9.5%
Median7.3%9.1%
Interquartile 25% (IQ1)5.2%8.0%
Interquartile 75% (IQ3)10.7%10.7%
Interquartile Range (IQR)5.5%2.7%
Standard Deviation (Sample)6.1%2.6%
Standard Deviation (Population)6.0%2.6%

Similar Demographics by Family Poverty

Demographics Similar to Slavs by Family Poverty

In terms of family poverty, the demographic groups most similar to Slavs are Immigrants from Eastern Europe (8.1%, a difference of 0.010%), Laotian (8.1%, a difference of 0.030%), Immigrants from Indonesia (8.1%, a difference of 0.10%), Immigrants from Norway (8.1%, a difference of 0.11%), and New Zealander (8.1%, a difference of 0.14%).
DemographicsRating | RankFamily Poverty
Immigrants | Switzerland
96.1
/100
|
#97
Exceptional
8.1%
Immigrants | South Africa
95.9
/100
|
#98
Exceptional
8.1%
Welsh
95.8
/100
|
#99
Exceptional
8.1%
New Zealanders
95.8
/100
|
#100
Exceptional
8.1%
Immigrants | Norway
95.7
/100
|
#101
Exceptional
8.1%
Immigrants | Indonesia
95.7
/100
|
#102
Exceptional
8.1%
Immigrants | Eastern Europe
95.6
/100
|
#103
Exceptional
8.1%
Slavs
95.6
/100
|
#104
Exceptional
8.1%
Laotians
95.6
/100
|
#105
Exceptional
8.1%
Egyptians
95.1
/100
|
#106
Exceptional
8.1%
French Canadians
95.0
/100
|
#107
Exceptional
8.1%
Basques
94.9
/100
|
#108
Exceptional
8.1%
Jordanians
94.8
/100
|
#109
Exceptional
8.2%
Romanians
94.7
/100
|
#110
Exceptional
8.2%
Taiwanese
94.6
/100
|
#111
Exceptional
8.2%

Demographics Similar to Immigrants from South America by Family Poverty

In terms of family poverty, the demographic groups most similar to Immigrants from South America are Aleut (9.5%, a difference of 0.010%), Immigrants from Lebanon (9.4%, a difference of 0.20%), German Russian (9.4%, a difference of 0.30%), Immigrants from Sierra Leone (9.4%, a difference of 0.34%), and Immigrants from Portugal (9.4%, a difference of 0.52%).
DemographicsRating | RankFamily Poverty
Spaniards
22.8
/100
|
#199
Fair
9.4%
Immigrants | Costa Rica
21.7
/100
|
#200
Fair
9.4%
Immigrants | Portugal
20.5
/100
|
#201
Fair
9.4%
Immigrants | Sierra Leone
19.6
/100
|
#202
Poor
9.4%
German Russians
19.4
/100
|
#203
Poor
9.4%
Immigrants | Lebanon
18.9
/100
|
#204
Poor
9.4%
Aleuts
18.0
/100
|
#205
Poor
9.5%
Immigrants | South America
18.0
/100
|
#206
Poor
9.5%
Sierra Leoneans
15.6
/100
|
#207
Poor
9.5%
Immigrants | Eastern Africa
15.1
/100
|
#208
Poor
9.5%
Immigrants | Uruguay
14.0
/100
|
#209
Poor
9.5%
Alsatians
11.3
/100
|
#210
Poor
9.6%
Malaysians
10.6
/100
|
#211
Poor
9.6%
Immigrants | Thailand
9.7
/100
|
#212
Tragic
9.7%
Osage
8.0
/100
|
#213
Tragic
9.7%