Sioux vs Peruvian Seniors Poverty Over the Age of 65
COMPARE
Sioux
Peruvian
Seniors Poverty Over the Age of 65
Seniors Poverty Over the Age of 65 Comparison
Sioux
Peruvians
15.3%
SENIORS POVERTY OVER THE AGE OF 65
0.0/ 100
METRIC RATING
328th/ 347
METRIC RANK
11.7%
SENIORS POVERTY OVER THE AGE OF 65
4.2/ 100
METRIC RATING
220th/ 347
METRIC RANK
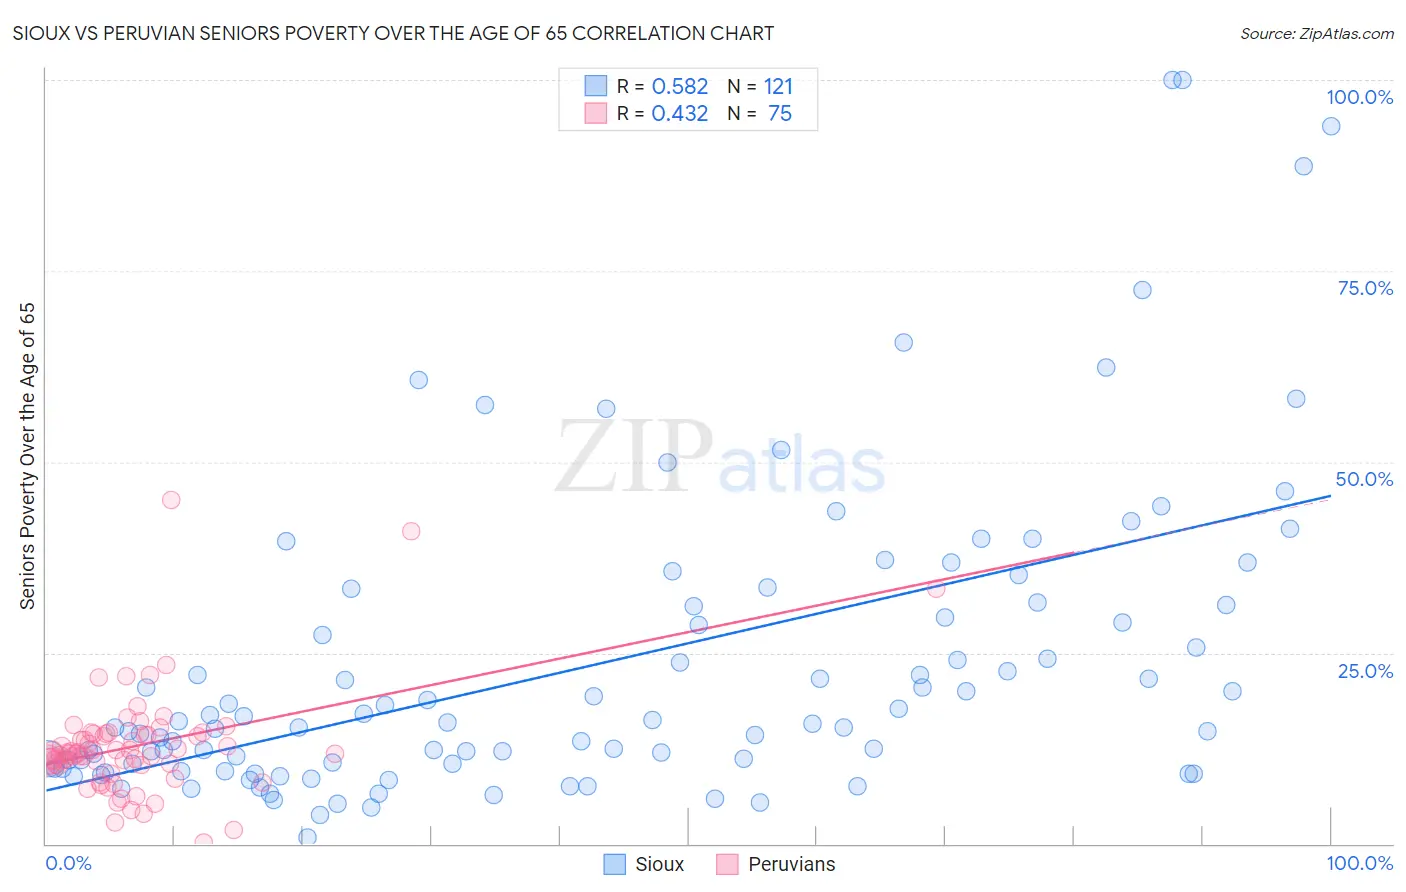
Sioux vs Peruvian Seniors Poverty Over the Age of 65 Correlation Chart
The statistical analysis conducted on geographies consisting of 233,565,707 people shows a substantial positive correlation between the proportion of Sioux and poverty level among seniors over the age of 65 in the United States with a correlation coefficient (R) of 0.582 and weighted average of 15.3%. Similarly, the statistical analysis conducted on geographies consisting of 361,980,796 people shows a moderate positive correlation between the proportion of Peruvians and poverty level among seniors over the age of 65 in the United States with a correlation coefficient (R) of 0.432 and weighted average of 11.7%, a difference of 30.8%.
Seniors Poverty Over the Age of 65 Correlation Summary
| Measurement | Sioux | Peruvian |
| Minimum | 0.89% | 0.12% |
| Maximum | 100.0% | 45.0% |
| Range | 99.1% | 44.9% |
| Mean | 23.4% | 12.8% |
| Median | 15.7% | 11.8% |
| Interquartile 25% (IQ1) | 10.2% | 10.3% |
| Interquartile 75% (IQ3) | 31.2% | 14.4% |
| Interquartile Range (IQR) | 21.0% | 4.1% |
| Standard Deviation (Sample) | 20.2% | 7.1% |
| Standard Deviation (Population) | 20.1% | 7.0% |
Similar Demographics by Seniors Poverty Over the Age of 65
Demographics Similar to Sioux by Seniors Poverty Over the Age of 65
In terms of seniors poverty over the age of 65, the demographic groups most similar to Sioux are Crow (15.2%, a difference of 0.54%), Immigrants from Armenia (15.2%, a difference of 0.79%), Immigrants from Dominica (15.5%, a difference of 1.1%), Immigrants from St. Vincent and the Grenadines (15.5%, a difference of 1.4%), and Central American Indian (15.1%, a difference of 1.4%).
| Demographics | Rating | Rank | Seniors Poverty Over the Age of 65 |
| Houma | 0.0 /100 | #321 | Tragic 14.7% |
| Immigrants | Barbados | 0.0 /100 | #322 | Tragic 14.8% |
| Yakama | 0.0 /100 | #323 | Tragic 14.8% |
| Nicaraguans | 0.0 /100 | #324 | Tragic 15.0% |
| Central American Indians | 0.0 /100 | #325 | Tragic 15.1% |
| Immigrants | Armenia | 0.0 /100 | #326 | Tragic 15.2% |
| Crow | 0.0 /100 | #327 | Tragic 15.2% |
| Sioux | 0.0 /100 | #328 | Tragic 15.3% |
| Immigrants | Dominica | 0.0 /100 | #329 | Tragic 15.5% |
| Immigrants | St. Vincent and the Grenadines | 0.0 /100 | #330 | Tragic 15.5% |
| British West Indians | 0.0 /100 | #331 | Tragic 15.6% |
| Immigrants | Grenada | 0.0 /100 | #332 | Tragic 15.8% |
| Immigrants | Yemen | 0.0 /100 | #333 | Tragic 15.9% |
| Immigrants | Nicaragua | 0.0 /100 | #334 | Tragic 15.9% |
| Cubans | 0.0 /100 | #335 | Tragic 16.1% |
Demographics Similar to Peruvians by Seniors Poverty Over the Age of 65
In terms of seniors poverty over the age of 65, the demographic groups most similar to Peruvians are Argentinean (11.7%, a difference of 0.070%), Immigrants from Chile (11.7%, a difference of 0.18%), Immigrants from Congo (11.7%, a difference of 0.22%), Immigrants from Nigeria (11.7%, a difference of 0.46%), and Arapaho (11.6%, a difference of 0.48%).
| Demographics | Rating | Rank | Seniors Poverty Over the Age of 65 |
| Nepalese | 8.9 /100 | #213 | Tragic 11.5% |
| Immigrants | Russia | 8.8 /100 | #214 | Tragic 11.5% |
| French American Indians | 8.7 /100 | #215 | Tragic 11.5% |
| Immigrants | Morocco | 6.8 /100 | #216 | Tragic 11.6% |
| Immigrants | Africa | 6.4 /100 | #217 | Tragic 11.6% |
| Immigrants | Ukraine | 5.7 /100 | #218 | Tragic 11.6% |
| Arapaho | 5.2 /100 | #219 | Tragic 11.6% |
| Peruvians | 4.2 /100 | #220 | Tragic 11.7% |
| Argentineans | 4.1 /100 | #221 | Tragic 11.7% |
| Immigrants | Chile | 3.9 /100 | #222 | Tragic 11.7% |
| Immigrants | Congo | 3.8 /100 | #223 | Tragic 11.7% |
| Immigrants | Nigeria | 3.4 /100 | #224 | Tragic 11.7% |
| Immigrants | Belarus | 3.2 /100 | #225 | Tragic 11.8% |
| Liberians | 3.2 /100 | #226 | Tragic 11.8% |
| Nigerians | 3.2 /100 | #227 | Tragic 11.8% |