Serbian vs Seminole Single Male Poverty

COMPARE

Serbian
Race
Ancestry
AfghanAfricanAlaska NativeAlaskan AthabascanAlbanianAleutAlsatianAmericanApacheArabArapahoArgentineanArmenianAssyrian/Chaldean/SyriacAustralianAustrianBahamianBangladeshiBarbadianBasqueBelgianBelizeanBermudanBhutaneseBlackfeetBolivianBrazilianBritishBritish West IndianBulgarianBurmeseCajunCambodianCanadianCape VerdeanCarpatho RusynCelticCentral AmericanCentral American IndianCherokeeCheyenneChickasawChileanChineseChippewaChoctawColombianColvilleComancheCosta RicanCreeCreekCroatianCrowCubanCypriotCzechCzechoslovakianDanishDelawareDominicanDutchDutch West IndianEastern EuropeanEcuadorianEgyptianEnglishEstonianEthiopianEuropeanFijianFilipinoFinnishFrenchFrench American IndianFrench CanadianGermanGerman RussianGhanaianGreekGuamanian/ChamorroGuatemalanGuyaneseHaitianHmongHonduranHopiHoumaHungarianIcelanderIndian (Asian)IndonesianInupiatIranianIraqiIrishIroquoisIsraeliItalianJamaicanJapaneseJordanianKenyanKiowaKoreanLaotianLatvianLebaneseLiberianLithuanianLumbeeLuxembourgerMacedonianMalaysianMalteseMarshalleseMenomineeMexicanMexican American IndianMongolianMoroccanNative HawaiianNavajoNepaleseNew ZealanderNicaraguanNigerianNorthern EuropeanNorwegianOkinawanOsageOttawaPaiutePakistaniPalestinianPanamanianParaguayanPennsylvania GermanPeruvianPimaPolishPortuguesePotawatomiPuebloPuerto RicanPuget Sound SalishRomanianRussianSalvadoranSamoanScandinavianScotch-IrishScottishSenegaleseSerbianShoshoneSierra LeoneanSiouxSlavicSlovakSloveneSomaliSouth AfricanSouth AmericanSouth American IndianSoviet UnionSpaniardSpanishSpanish AmericanSpanish American IndianSri LankanSubsaharan AfricanSudaneseSwedishSwissSyrianTaiwaneseThaiTlingit-HaidaTohono O'OdhamTonganTrinidadian and TobagonianTsimshianTurkishU.S. Virgin IslanderUgandanUkrainianUruguayanUteVenezuelanVietnameseWelshWest IndianYakamaYaquiYugoslavianYumanYup'ikZimbabwean
Immigration
NonimmigrantsImmigrantsAfghanistanAfricaAlbaniaArgentinaArmeniaAsiaAustraliaAustriaBahamasBangladeshBarbadosBelarusBelgiumBelizeBoliviaBosnia and HerzegovinaBrazilBulgariaBurma/MyanmarCabo VerdeCambodiaCameroonCanadaCaribbeanCentral AmericaChileChinaColombiaCongoCosta RicaCroatiaCubaCzechoslovakiaDenmarkDominicaDominican RepublicEastern AfricaEastern AsiaEastern EuropeEcuadorEgyptEl SalvadorEnglandEritreaEthiopiaEuropeFijiFranceGermanyGhanaGreeceGrenadaGuatemalaGuyanaHaitiHondurasHong KongHungaryIndiaIndonesiaIranIraqIrelandIsraelItalyJamaicaJapanJordanKazakhstanKenyaKoreaKuwaitLaosLatin AmericaLatviaLebanonLiberiaLithuaniaMalaysiaMexicoMicronesiaMiddle AfricaMoldovaMoroccoNepalNetherlandsNicaraguaNigeriaNorth AmericaNorth MacedoniaNorthern AfricaNorthern EuropeNorwayOceaniaPakistanPanamaPeruPhilippinesPolandPortugalRomaniaRussiaSaudi ArabiaScotlandSenegalSerbiaSierra LeoneSingaporeSomaliaSouth AfricaSouth AmericaSouth Central AsiaSouth Eastern AsiaSouthern EuropeSpainSri LankaSt. Vincent and the GrenadinesSudanSwedenSwitzerlandSyriaTaiwanThailandTrinidad and TobagoTurkeyUgandaUkraineUruguayUzbekistanVenezuelaVietnamWest IndiesWestern AfricaWestern AsiaWestern EuropeYemenZaireZimbabweAzores
Seminole
Race
Ancestry
AfghanAfricanAlaska NativeAlaskan AthabascanAlbanianAleutAlsatianAmericanApacheArabArapahoArgentineanArmenianAssyrian/Chaldean/SyriacAustralianAustrianBahamianBangladeshiBarbadianBasqueBelgianBelizeanBermudanBhutaneseBlackfeetBolivianBrazilianBritishBritish West IndianBulgarianBurmeseCajunCambodianCanadianCape VerdeanCarpatho RusynCelticCentral AmericanCentral American IndianCherokeeCheyenneChickasawChileanChineseChippewaChoctawColombianColvilleComancheCosta RicanCreeCreekCroatianCrowCubanCypriotCzechCzechoslovakianDanishDelawareDominicanDutchDutch West IndianEastern EuropeanEcuadorianEgyptianEnglishEstonianEthiopianEuropeanFijianFilipinoFinnishFrenchFrench American IndianFrench CanadianGermanGerman RussianGhanaianGreekGuamanian/ChamorroGuatemalanGuyaneseHaitianHmongHonduranHopiHoumaHungarianIcelanderIndian (Asian)IndonesianInupiatIranianIraqiIrishIroquoisIsraeliItalianJamaicanJapaneseJordanianKenyanKiowaKoreanLaotianLatvianLebaneseLiberianLithuanianLumbeeLuxembourgerMacedonianMalaysianMalteseMarshalleseMenomineeMexicanMexican American IndianMongolianMoroccanNative HawaiianNavajoNepaleseNew ZealanderNicaraguanNigerianNorthern EuropeanNorwegianOkinawanOsageOttawaPaiutePakistaniPalestinianPanamanianParaguayanPennsylvania GermanPeruvianPimaPolishPortuguesePotawatomiPuebloPuerto RicanPuget Sound SalishRomanianRussianSalvadoranSamoanScandinavianScotch-IrishScottishSeminoleSenegaleseShoshoneSierra LeoneanSiouxSlavicSlovakSloveneSomaliSouth AfricanSouth AmericanSouth American IndianSoviet UnionSpaniardSpanishSpanish AmericanSpanish American IndianSri LankanSubsaharan AfricanSudaneseSwedishSwissSyrianTaiwaneseThaiTlingit-HaidaTohono O'OdhamTonganTrinidadian and TobagonianTsimshianTurkishU.S. Virgin IslanderUgandanUkrainianUruguayanUteVenezuelanVietnameseWelshWest IndianYakamaYaquiYugoslavianYumanYup'ikZimbabwean
Immigration
NonimmigrantsImmigrantsAfghanistanAfricaAlbaniaArgentinaArmeniaAsiaAustraliaAustriaBahamasBangladeshBarbadosBelarusBelgiumBelizeBoliviaBosnia and HerzegovinaBrazilBulgariaBurma/MyanmarCabo VerdeCambodiaCameroonCanadaCaribbeanCentral AmericaChileChinaColombiaCongoCosta RicaCroatiaCubaCzechoslovakiaDenmarkDominicaDominican RepublicEastern AfricaEastern AsiaEastern EuropeEcuadorEgyptEl SalvadorEnglandEritreaEthiopiaEuropeFijiFranceGermanyGhanaGreeceGrenadaGuatemalaGuyanaHaitiHondurasHong KongHungaryIndiaIndonesiaIranIraqIrelandIsraelItalyJamaicaJapanJordanKazakhstanKenyaKoreaKuwaitLaosLatin AmericaLatviaLebanonLiberiaLithuaniaMalaysiaMexicoMicronesiaMiddle AfricaMoldovaMoroccoNepalNetherlandsNicaraguaNigeriaNorth AmericaNorth MacedoniaNorthern AfricaNorthern EuropeNorwayOceaniaPakistanPanamaPeruPhilippinesPolandPortugalRomaniaRussiaSaudi ArabiaScotlandSenegalSerbiaSierra LeoneSingaporeSomaliaSouth AfricaSouth AmericaSouth Central AsiaSouth Eastern AsiaSouthern EuropeSpainSri LankaSt. Vincent and the GrenadinesSudanSwedenSwitzerlandSyriaTaiwanThailandTrinidad and TobagoTurkeyUgandaUkraineUruguayUzbekistanVenezuelaVietnamWest IndiesWestern AfricaWestern AsiaWestern EuropeYemenZaireZimbabweAzores
Single Male Poverty
Income
Poverty
Unemployment
Labor Participation
Family Structure
Vehicle Availability
Education Level
Disability

Single Male Poverty Comparison

Serbians

Seminole

Excellent
Tragic
12.5%
SINGLE MALE POVERTY
87.9/ 100
METRIC RATING
122nd/ 347
METRIC RANK
16.0%
SINGLE MALE POVERTY
0.0/ 100
METRIC RATING
311th/ 347
METRIC RANK

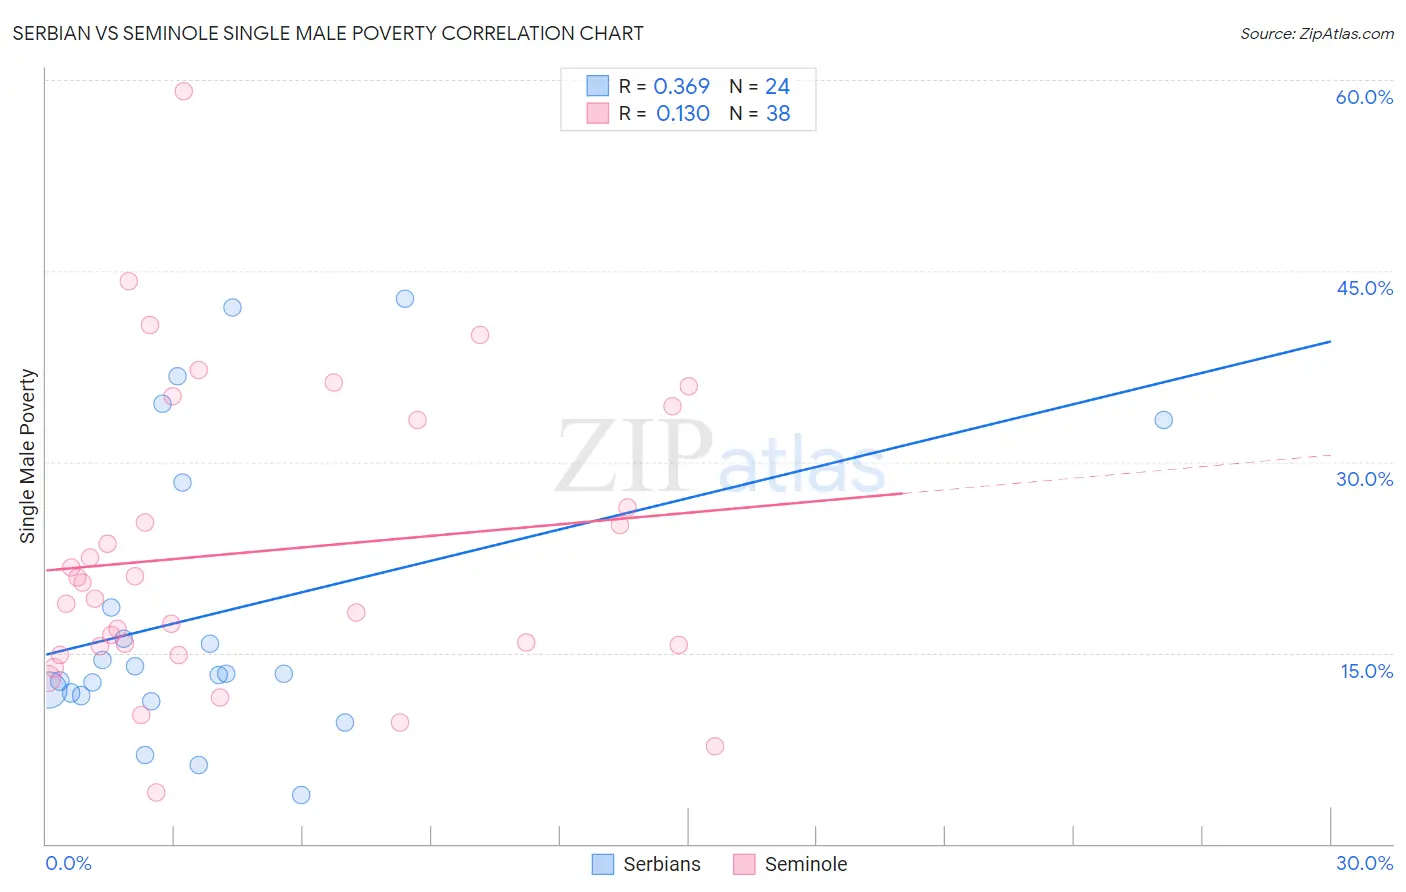
Serbian vs Seminole Single Male Poverty Correlation Chart

The statistical analysis conducted on geographies consisting of 240,171,110 people shows a mild positive correlation between the proportion of Serbians and poverty level among single males in the United States with a correlation coefficient (R) of 0.369 and weighted average of 12.5%. Similarly, the statistical analysis conducted on geographies consisting of 113,333,266 people shows a poor positive correlation between the proportion of Seminole and poverty level among single males in the United States with a correlation coefficient (R) of 0.130 and weighted average of 16.0%, a difference of 28.5%.
Serbian vs Seminole Single Male Poverty

Single Male Poverty Correlation Summary

MeasurementSerbianSeminole
Minimum3.8%4.0%
Maximum42.9%59.1%
Range39.0%55.1%
Mean18.1%22.9%
Median13.3%19.9%
Interquartile 25% (IQ1)11.7%15.5%
Interquartile 75% (IQ3)23.5%33.3%
Interquartile Range (IQR)11.7%17.9%
Standard Deviation (Sample)11.5%11.7%
Standard Deviation (Population)11.2%11.6%

Similar Demographics by Single Male Poverty

Demographics Similar to Serbians by Single Male Poverty

In terms of single male poverty, the demographic groups most similar to Serbians are Immigrants from Kenya (12.5%, a difference of 0.040%), Icelander (12.5%, a difference of 0.050%), Russian (12.5%, a difference of 0.070%), Immigrants from Jordan (12.5%, a difference of 0.10%), and Romanian (12.5%, a difference of 0.18%).
DemographicsRating | RankSingle Male Poverty
Immigrants | Southern Europe
91.5
/100
|
#115
Exceptional
12.4%
Immigrants | Syria
91.2
/100
|
#116
Exceptional
12.4%
Immigrants | Oceania
91.1
/100
|
#117
Exceptional
12.4%
Albanians
90.6
/100
|
#118
Exceptional
12.4%
Immigrants | Albania
90.3
/100
|
#119
Exceptional
12.4%
Venezuelans
89.4
/100
|
#120
Excellent
12.4%
Icelanders
88.2
/100
|
#121
Excellent
12.5%
Serbians
87.9
/100
|
#122
Excellent
12.5%
Immigrants | Kenya
87.6
/100
|
#123
Excellent
12.5%
Russians
87.3
/100
|
#124
Excellent
12.5%
Immigrants | Jordan
87.1
/100
|
#125
Excellent
12.5%
Romanians
86.4
/100
|
#126
Excellent
12.5%
Immigrants | Netherlands
86.2
/100
|
#127
Excellent
12.5%
Ecuadorians
85.9
/100
|
#128
Excellent
12.5%
Immigrants | Sierra Leone
85.5
/100
|
#129
Excellent
12.5%

Demographics Similar to Seminole by Single Male Poverty

In terms of single male poverty, the demographic groups most similar to Seminole are Comanche (16.0%, a difference of 0.0%), Cherokee (16.1%, a difference of 0.23%), Alaskan Athabascan (16.1%, a difference of 0.52%), Yakama (15.9%, a difference of 0.54%), and Cheyenne (16.1%, a difference of 0.57%).
DemographicsRating | RankSingle Male Poverty
Alaska Natives
0.0
/100
|
#304
Tragic
15.4%
Blackfeet
0.0
/100
|
#305
Tragic
15.5%
Pennsylvania Germans
0.0
/100
|
#306
Tragic
15.6%
Ute
0.0
/100
|
#307
Tragic
15.7%
Potawatomi
0.0
/100
|
#308
Tragic
15.8%
Americans
0.0
/100
|
#309
Tragic
15.8%
Yakama
0.0
/100
|
#310
Tragic
15.9%
Seminole
0.0
/100
|
#311
Tragic
16.0%
Comanche
0.0
/100
|
#312
Tragic
16.0%
Cherokee
0.0
/100
|
#313
Tragic
16.1%
Alaskan Athabascans
0.0
/100
|
#314
Tragic
16.1%
Cheyenne
0.0
/100
|
#315
Tragic
16.1%
Dutch West Indians
0.0
/100
|
#316
Tragic
16.1%
Blacks/African Americans
0.0
/100
|
#317
Tragic
16.2%
Chickasaw
0.0
/100
|
#318
Tragic
16.3%