Serbian vs Paraguayan Female Poverty Among 25-34 Year Olds

COMPARE

Serbian
Race
Ancestry
AfghanAfricanAlaska NativeAlaskan AthabascanAlbanianAleutAlsatianAmericanApacheArabArapahoArgentineanArmenianAssyrian/Chaldean/SyriacAustralianAustrianBahamianBangladeshiBarbadianBasqueBelgianBelizeanBermudanBhutaneseBlackfeetBolivianBrazilianBritishBritish West IndianBulgarianBurmeseCajunCambodianCanadianCape VerdeanCarpatho RusynCelticCentral AmericanCentral American IndianCherokeeCheyenneChickasawChileanChineseChippewaChoctawColombianColvilleComancheCosta RicanCreeCreekCroatianCrowCubanCypriotCzechCzechoslovakianDanishDelawareDominicanDutchDutch West IndianEastern EuropeanEcuadorianEgyptianEnglishEstonianEthiopianEuropeanFijianFilipinoFinnishFrenchFrench American IndianFrench CanadianGermanGerman RussianGhanaianGreekGuamanian/ChamorroGuatemalanGuyaneseHaitianHmongHonduranHopiHoumaHungarianIcelanderIndian (Asian)IndonesianInupiatIranianIraqiIrishIroquoisIsraeliItalianJamaicanJapaneseJordanianKenyanKiowaKoreanLaotianLatvianLebaneseLiberianLithuanianLumbeeLuxembourgerMacedonianMalaysianMalteseMarshalleseMenomineeMexicanMexican American IndianMongolianMoroccanNative HawaiianNavajoNepaleseNew ZealanderNicaraguanNigerianNorthern EuropeanNorwegianOkinawanOsageOttawaPaiutePakistaniPalestinianPanamanianPennsylvania GermanPeruvianPimaPolishPortuguesePotawatomiPuebloPuerto RicanPuget Sound SalishRomanianRussianSalvadoranSamoanScandinavianScotch-IrishScottishSeminoleSenegaleseSerbianShoshoneSierra LeoneanSiouxSlavicSlovakSloveneSomaliSouth AfricanSouth AmericanSouth American IndianSoviet UnionSpaniardSpanishSpanish AmericanSpanish American IndianSri LankanSubsaharan AfricanSudaneseSwedishSwissSyrianTaiwaneseThaiTlingit-HaidaTohono O'OdhamTonganTrinidadian and TobagonianTsimshianTurkishU.S. Virgin IslanderUgandanUkrainianUruguayanUteVenezuelanVietnameseWelshWest IndianYakamaYaquiYugoslavianYumanYup'ikZimbabwean
Immigration
NonimmigrantsImmigrantsAfghanistanAfricaAlbaniaArgentinaArmeniaAsiaAustraliaAustriaBahamasBangladeshBarbadosBelarusBelgiumBelizeBoliviaBosnia and HerzegovinaBrazilBulgariaBurma/MyanmarCabo VerdeCambodiaCameroonCanadaCaribbeanCentral AmericaChileChinaColombiaCongoCosta RicaCroatiaCubaCzechoslovakiaDenmarkDominicaDominican RepublicEastern AfricaEastern AsiaEastern EuropeEcuadorEgyptEl SalvadorEnglandEritreaEthiopiaEuropeFijiFranceGermanyGhanaGreeceGrenadaGuatemalaGuyanaHaitiHondurasHong KongHungaryIndiaIndonesiaIranIraqIrelandIsraelItalyJamaicaJapanJordanKazakhstanKenyaKoreaKuwaitLaosLatin AmericaLatviaLebanonLiberiaLithuaniaMalaysiaMexicoMicronesiaMiddle AfricaMoldovaMoroccoNepalNetherlandsNicaraguaNigeriaNorth AmericaNorth MacedoniaNorthern AfricaNorthern EuropeNorwayOceaniaPakistanPanamaPeruPhilippinesPolandPortugalRomaniaRussiaSaudi ArabiaScotlandSenegalSerbiaSierra LeoneSingaporeSomaliaSouth AfricaSouth AmericaSouth Central AsiaSouth Eastern AsiaSouthern EuropeSpainSri LankaSt. Vincent and the GrenadinesSudanSwedenSwitzerlandSyriaTaiwanThailandTrinidad and TobagoTurkeyUgandaUkraineUruguayUzbekistanVenezuelaVietnamWest IndiesWestern AfricaWestern AsiaWestern EuropeYemenZaireZimbabweAzores
Paraguayan
Race
Ancestry
AfghanAfricanAlaska NativeAlaskan AthabascanAlbanianAleutAlsatianAmericanApacheArabArapahoArgentineanArmenianAssyrian/Chaldean/SyriacAustralianAustrianBahamianBangladeshiBarbadianBasqueBelgianBelizeanBermudanBhutaneseBlackfeetBolivianBrazilianBritishBritish West IndianBulgarianBurmeseCajunCambodianCanadianCape VerdeanCarpatho RusynCelticCentral AmericanCentral American IndianCherokeeCheyenneChickasawChileanChineseChippewaChoctawColombianColvilleComancheCosta RicanCreeCreekCroatianCrowCubanCypriotCzechCzechoslovakianDanishDelawareDominicanDutchDutch West IndianEastern EuropeanEcuadorianEgyptianEnglishEstonianEthiopianEuropeanFijianFilipinoFinnishFrenchFrench American IndianFrench CanadianGermanGerman RussianGhanaianGreekGuamanian/ChamorroGuatemalanGuyaneseHaitianHmongHonduranHopiHoumaHungarianIcelanderIndian (Asian)IndonesianInupiatIranianIraqiIrishIroquoisIsraeliItalianJamaicanJapaneseJordanianKenyanKiowaKoreanLaotianLatvianLebaneseLiberianLithuanianLumbeeLuxembourgerMacedonianMalaysianMalteseMarshalleseMenomineeMexicanMexican American IndianMongolianMoroccanNative HawaiianNavajoNepaleseNew ZealanderNicaraguanNigerianNorthern EuropeanNorwegianOkinawanOsageOttawaPaiutePakistaniPalestinianPanamanianParaguayanPennsylvania GermanPeruvianPimaPolishPortuguesePotawatomiPuebloPuerto RicanPuget Sound SalishRomanianRussianSalvadoranSamoanScandinavianScotch-IrishScottishSeminoleSenegaleseShoshoneSierra LeoneanSiouxSlavicSlovakSloveneSomaliSouth AfricanSouth AmericanSouth American IndianSoviet UnionSpaniardSpanishSpanish AmericanSpanish American IndianSri LankanSubsaharan AfricanSudaneseSwedishSwissSyrianTaiwaneseThaiTlingit-HaidaTohono O'OdhamTonganTrinidadian and TobagonianTsimshianTurkishU.S. Virgin IslanderUgandanUkrainianUruguayanUteVenezuelanVietnameseWelshWest IndianYakamaYaquiYugoslavianYumanYup'ikZimbabwean
Immigration
NonimmigrantsImmigrantsAfghanistanAfricaAlbaniaArgentinaArmeniaAsiaAustraliaAustriaBahamasBangladeshBarbadosBelarusBelgiumBelizeBoliviaBosnia and HerzegovinaBrazilBulgariaBurma/MyanmarCabo VerdeCambodiaCameroonCanadaCaribbeanCentral AmericaChileChinaColombiaCongoCosta RicaCroatiaCubaCzechoslovakiaDenmarkDominicaDominican RepublicEastern AfricaEastern AsiaEastern EuropeEcuadorEgyptEl SalvadorEnglandEritreaEthiopiaEuropeFijiFranceGermanyGhanaGreeceGrenadaGuatemalaGuyanaHaitiHondurasHong KongHungaryIndiaIndonesiaIranIraqIrelandIsraelItalyJamaicaJapanJordanKazakhstanKenyaKoreaKuwaitLaosLatin AmericaLatviaLebanonLiberiaLithuaniaMalaysiaMexicoMicronesiaMiddle AfricaMoldovaMoroccoNepalNetherlandsNicaraguaNigeriaNorth AmericaNorth MacedoniaNorthern AfricaNorthern EuropeNorwayOceaniaPakistanPanamaPeruPhilippinesPolandPortugalRomaniaRussiaSaudi ArabiaScotlandSenegalSerbiaSierra LeoneSingaporeSomaliaSouth AfricaSouth AmericaSouth Central AsiaSouth Eastern AsiaSouthern EuropeSpainSri LankaSt. Vincent and the GrenadinesSudanSwedenSwitzerlandSyriaTaiwanThailandTrinidad and TobagoTurkeyUgandaUkraineUruguayUzbekistanVenezuelaVietnamWest IndiesWestern AfricaWestern AsiaWestern EuropeYemenZaireZimbabweAzores
Female Poverty Among 25-34 Year Olds
Income
Poverty
Unemployment
Labor Participation
Family Structure
Vehicle Availability
Education Level
Disability

Female Poverty Among 25-34 Year Olds Comparison

Serbians

Paraguayans

Excellent
Exceptional
13.0%
FEMALE POVERTY AMONG 25-34 YEAR OLDS
87.6/ 100
METRIC RATING
133rd/ 347
METRIC RANK
12.0%
FEMALE POVERTY AMONG 25-34 YEAR OLDS
99.6/ 100
METRIC RATING
51st/ 347
METRIC RANK

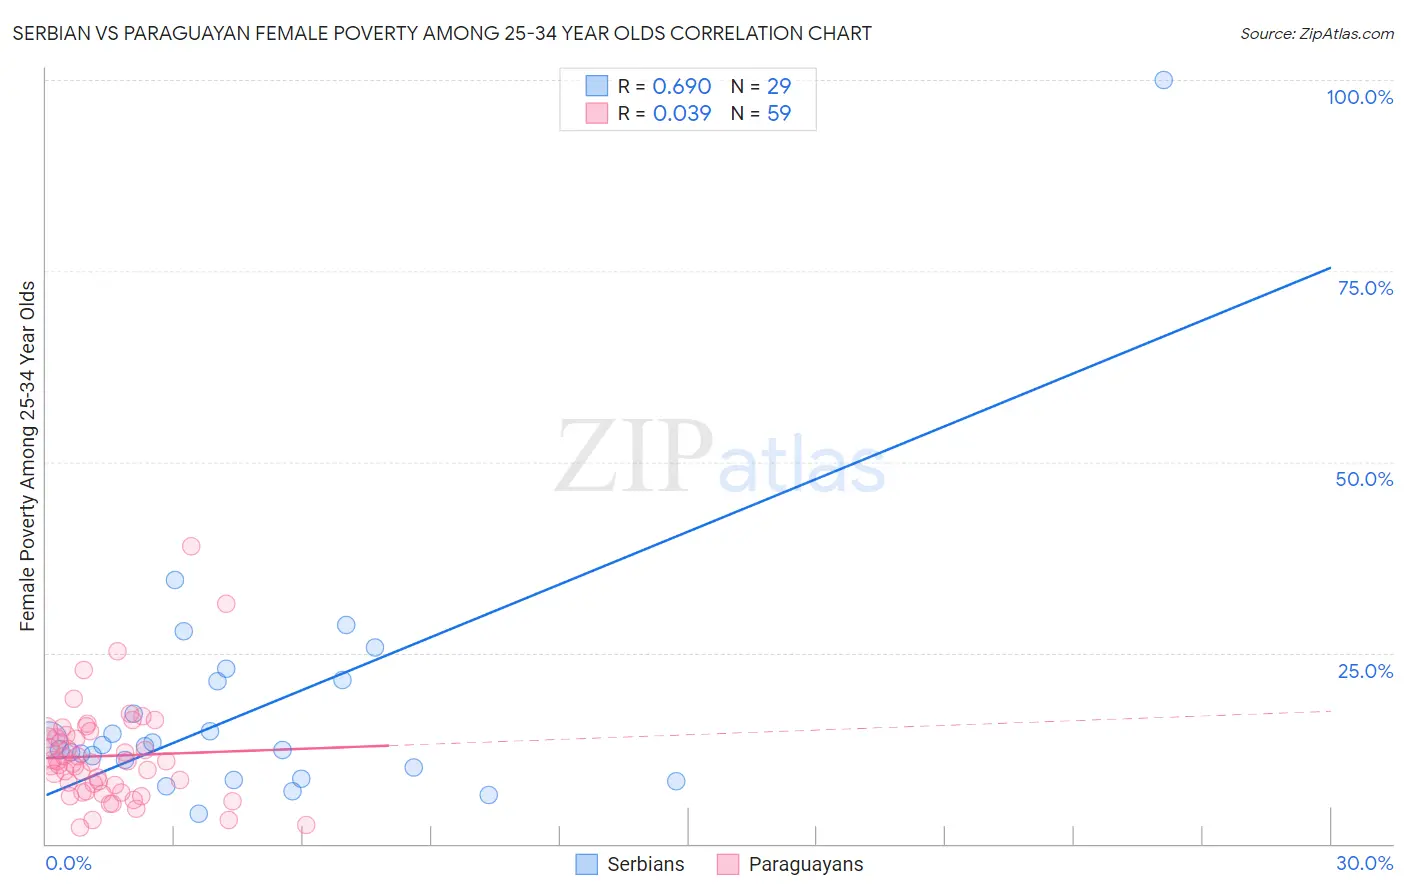
Serbian vs Paraguayan Female Poverty Among 25-34 Year Olds Correlation Chart

The statistical analysis conducted on geographies consisting of 264,148,208 people shows a significant positive correlation between the proportion of Serbians and poverty level among females between the ages 25 and 34 in the United States with a correlation coefficient (R) of 0.690 and weighted average of 13.0%. Similarly, the statistical analysis conducted on geographies consisting of 94,529,967 people shows no correlation between the proportion of Paraguayans and poverty level among females between the ages 25 and 34 in the United States with a correlation coefficient (R) of 0.039 and weighted average of 12.0%, a difference of 8.4%.
Serbian vs Paraguayan Female Poverty Among 25-34 Year Olds

Female Poverty Among 25-34 Year Olds Correlation Summary

MeasurementSerbianParaguayan
Minimum3.9%2.1%
Maximum100.0%39.0%
Range96.1%36.9%
Mean17.6%11.5%
Median12.8%10.6%
Interquartile 25% (IQ1)9.2%6.8%
Interquartile 75% (IQ3)21.3%14.3%
Interquartile Range (IQR)12.1%7.5%
Standard Deviation (Sample)17.5%6.5%
Standard Deviation (Population)17.2%6.5%

Similar Demographics by Female Poverty Among 25-34 Year Olds

Demographics Similar to Serbians by Female Poverty Among 25-34 Year Olds

In terms of female poverty among 25-34 year olds, the demographic groups most similar to Serbians are Immigrants from Hungary (13.0%, a difference of 0.14%), Pakistani (13.0%, a difference of 0.15%), Afghan (13.0%, a difference of 0.35%), South African (13.0%, a difference of 0.37%), and Immigrants from England (13.0%, a difference of 0.39%).
DemographicsRating | RankFemale Poverty Among 25-34 Year Olds
Immigrants | Fiji
91.2
/100
|
#126
Exceptional
12.9%
Czechs
90.3
/100
|
#127
Exceptional
12.9%
Syrians
90.2
/100
|
#128
Exceptional
12.9%
Immigrants | North America
89.7
/100
|
#129
Excellent
12.9%
Immigrants | Uzbekistan
89.6
/100
|
#130
Excellent
12.9%
Pakistanis
88.4
/100
|
#131
Excellent
13.0%
Immigrants | Hungary
88.3
/100
|
#132
Excellent
13.0%
Serbians
87.6
/100
|
#133
Excellent
13.0%
Afghans
85.8
/100
|
#134
Excellent
13.0%
South Africans
85.7
/100
|
#135
Excellent
13.0%
Immigrants | England
85.5
/100
|
#136
Excellent
13.0%
Immigrants | Chile
84.6
/100
|
#137
Excellent
13.1%
Brazilians
84.5
/100
|
#138
Excellent
13.1%
Austrians
83.7
/100
|
#139
Excellent
13.1%
Immigrants | Iraq
83.6
/100
|
#140
Excellent
13.1%

Demographics Similar to Paraguayans by Female Poverty Among 25-34 Year Olds

In terms of female poverty among 25-34 year olds, the demographic groups most similar to Paraguayans are Immigrants from Croatia (12.0%, a difference of 0.010%), Immigrants from Egypt (12.0%, a difference of 0.020%), Immigrants from Eastern Europe (12.0%, a difference of 0.020%), Immigrants from Belarus (12.0%, a difference of 0.10%), and Immigrants from Israel (12.0%, a difference of 0.14%).
DemographicsRating | RankFemale Poverty Among 25-34 Year Olds
Immigrants | Australia
99.7
/100
|
#44
Exceptional
11.9%
Macedonians
99.7
/100
|
#45
Exceptional
11.9%
Immigrants | Serbia
99.7
/100
|
#46
Exceptional
11.9%
Koreans
99.6
/100
|
#47
Exceptional
12.0%
Immigrants | Belarus
99.6
/100
|
#48
Exceptional
12.0%
Immigrants | Egypt
99.6
/100
|
#49
Exceptional
12.0%
Immigrants | Croatia
99.6
/100
|
#50
Exceptional
12.0%
Paraguayans
99.6
/100
|
#51
Exceptional
12.0%
Immigrants | Eastern Europe
99.6
/100
|
#52
Exceptional
12.0%
Immigrants | Israel
99.6
/100
|
#53
Exceptional
12.0%
Eastern Europeans
99.6
/100
|
#54
Exceptional
12.0%
Immigrants | Philippines
99.5
/100
|
#55
Exceptional
12.0%
Luxembourgers
99.5
/100
|
#56
Exceptional
12.1%
Jordanians
99.4
/100
|
#57
Exceptional
12.1%
Immigrants | Romania
99.4
/100
|
#58
Exceptional
12.1%