Senegalese vs Bolivian Child Poverty Under the Age of 16
COMPARE
Senegalese
Bolivian
Child Poverty Under the Age of 16
Child Poverty Under the Age of 16 Comparison
Senegalese
Bolivians
20.4%
CHILD POVERTY UNDER THE AGE OF 16
0.0/ 100
METRIC RATING
289th/ 347
METRIC RANK
13.2%
CHILD POVERTY UNDER THE AGE OF 16
99.8/ 100
METRIC RATING
26th/ 347
METRIC RANK
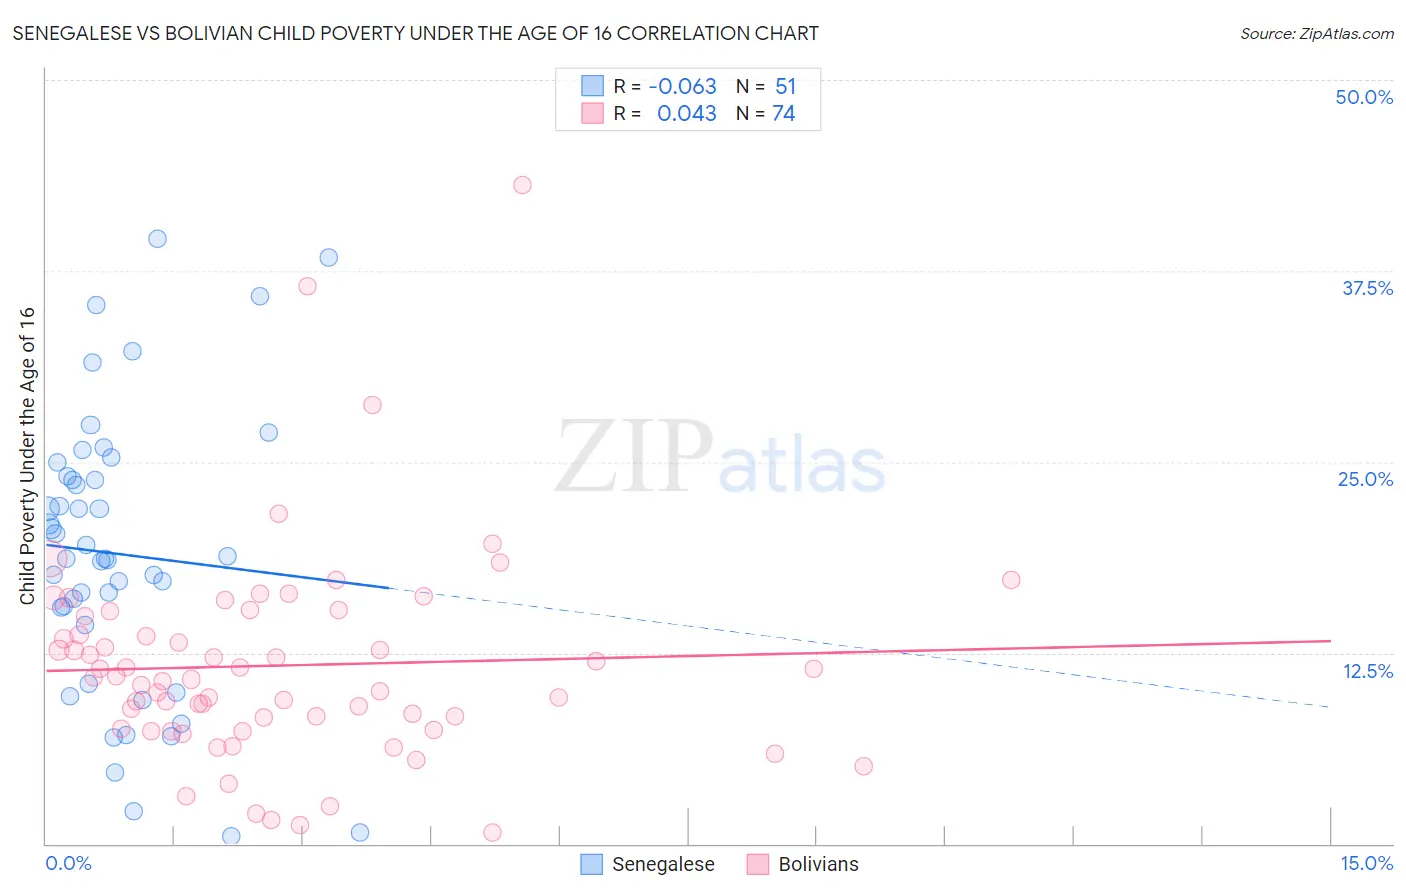
Senegalese vs Bolivian Child Poverty Under the Age of 16 Correlation Chart
The statistical analysis conducted on geographies consisting of 78,012,841 people shows a slight negative correlation between the proportion of Senegalese and poverty level among children under the age of 16 in the United States with a correlation coefficient (R) of -0.063 and weighted average of 20.4%. Similarly, the statistical analysis conducted on geographies consisting of 184,043,367 people shows no correlation between the proportion of Bolivians and poverty level among children under the age of 16 in the United States with a correlation coefficient (R) of 0.043 and weighted average of 13.2%, a difference of 53.8%.
Child Poverty Under the Age of 16 Correlation Summary
| Measurement | Senegalese | Bolivian |
| Minimum | 0.47% | 0.74% |
| Maximum | 39.6% | 43.1% |
| Range | 39.2% | 42.4% |
| Mean | 19.0% | 11.7% |
| Median | 18.7% | 10.8% |
| Interquartile 25% (IQ1) | 14.3% | 7.6% |
| Interquartile 75% (IQ3) | 24.1% | 14.9% |
| Interquartile Range (IQR) | 9.8% | 7.3% |
| Standard Deviation (Sample) | 9.2% | 6.9% |
| Standard Deviation (Population) | 9.1% | 6.8% |
Similar Demographics by Child Poverty Under the Age of 16
Demographics Similar to Senegalese by Child Poverty Under the Age of 16
In terms of child poverty under the age of 16, the demographic groups most similar to Senegalese are Yaqui (20.4%, a difference of 0.040%), Immigrants from Belize (20.3%, a difference of 0.24%), Chippewa (20.5%, a difference of 0.78%), Blackfeet (20.2%, a difference of 0.83%), and Immigrants from Latin America (20.5%, a difference of 0.83%).
| Demographics | Rating | Rank | Child Poverty Under the Age of 16 |
| Barbadians | 0.0 /100 | #282 | Tragic 20.0% |
| Immigrants | Zaire | 0.0 /100 | #283 | Tragic 20.1% |
| West Indians | 0.0 /100 | #284 | Tragic 20.1% |
| Immigrants | St. Vincent and the Grenadines | 0.0 /100 | #285 | Tragic 20.1% |
| Immigrants | West Indies | 0.0 /100 | #286 | Tragic 20.2% |
| Blackfeet | 0.0 /100 | #287 | Tragic 20.2% |
| Immigrants | Belize | 0.0 /100 | #288 | Tragic 20.3% |
| Senegalese | 0.0 /100 | #289 | Tragic 20.4% |
| Yaqui | 0.0 /100 | #290 | Tragic 20.4% |
| Chippewa | 0.0 /100 | #291 | Tragic 20.5% |
| Immigrants | Latin America | 0.0 /100 | #292 | Tragic 20.5% |
| Immigrants | Senegal | 0.0 /100 | #293 | Tragic 20.6% |
| Haitians | 0.0 /100 | #294 | Tragic 20.7% |
| Mexicans | 0.0 /100 | #295 | Tragic 20.7% |
| Immigrants | Caribbean | 0.0 /100 | #296 | Tragic 20.8% |
Demographics Similar to Bolivians by Child Poverty Under the Age of 16
In terms of child poverty under the age of 16, the demographic groups most similar to Bolivians are Immigrants from China (13.3%, a difference of 0.29%), Eastern European (13.2%, a difference of 0.42%), Latvian (13.2%, a difference of 0.50%), Assyrian/Chaldean/Syriac (13.3%, a difference of 0.53%), and Indian (Asian) (13.1%, a difference of 0.71%).
| Demographics | Rating | Rank | Child Poverty Under the Age of 16 |
| Immigrants | Japan | 99.8 /100 | #19 | Exceptional 13.0% |
| Okinawans | 99.8 /100 | #20 | Exceptional 13.1% |
| Immigrants | Eastern Asia | 99.8 /100 | #21 | Exceptional 13.1% |
| Maltese | 99.8 /100 | #22 | Exceptional 13.1% |
| Indians (Asian) | 99.8 /100 | #23 | Exceptional 13.1% |
| Latvians | 99.8 /100 | #24 | Exceptional 13.2% |
| Eastern Europeans | 99.8 /100 | #25 | Exceptional 13.2% |
| Bolivians | 99.8 /100 | #26 | Exceptional 13.2% |
| Immigrants | China | 99.8 /100 | #27 | Exceptional 13.3% |
| Assyrians/Chaldeans/Syriacs | 99.7 /100 | #28 | Exceptional 13.3% |
| Swedes | 99.7 /100 | #29 | Exceptional 13.3% |
| Turks | 99.7 /100 | #30 | Exceptional 13.4% |
| Danes | 99.7 /100 | #31 | Exceptional 13.4% |
| Tongans | 99.7 /100 | #32 | Exceptional 13.4% |
| Asians | 99.6 /100 | #33 | Exceptional 13.5% |