Scottish vs Immigrants from Serbia Family Poverty
COMPARE
Scottish
Immigrants from Serbia
Family Poverty
Family Poverty Comparison
Scottish
Immigrants from Serbia
7.9%
FAMILY POVERTY
97.3/ 100
METRIC RATING
86th/ 347
METRIC RANK
7.7%
FAMILY POVERTY
98.7/ 100
METRIC RATING
56th/ 347
METRIC RANK
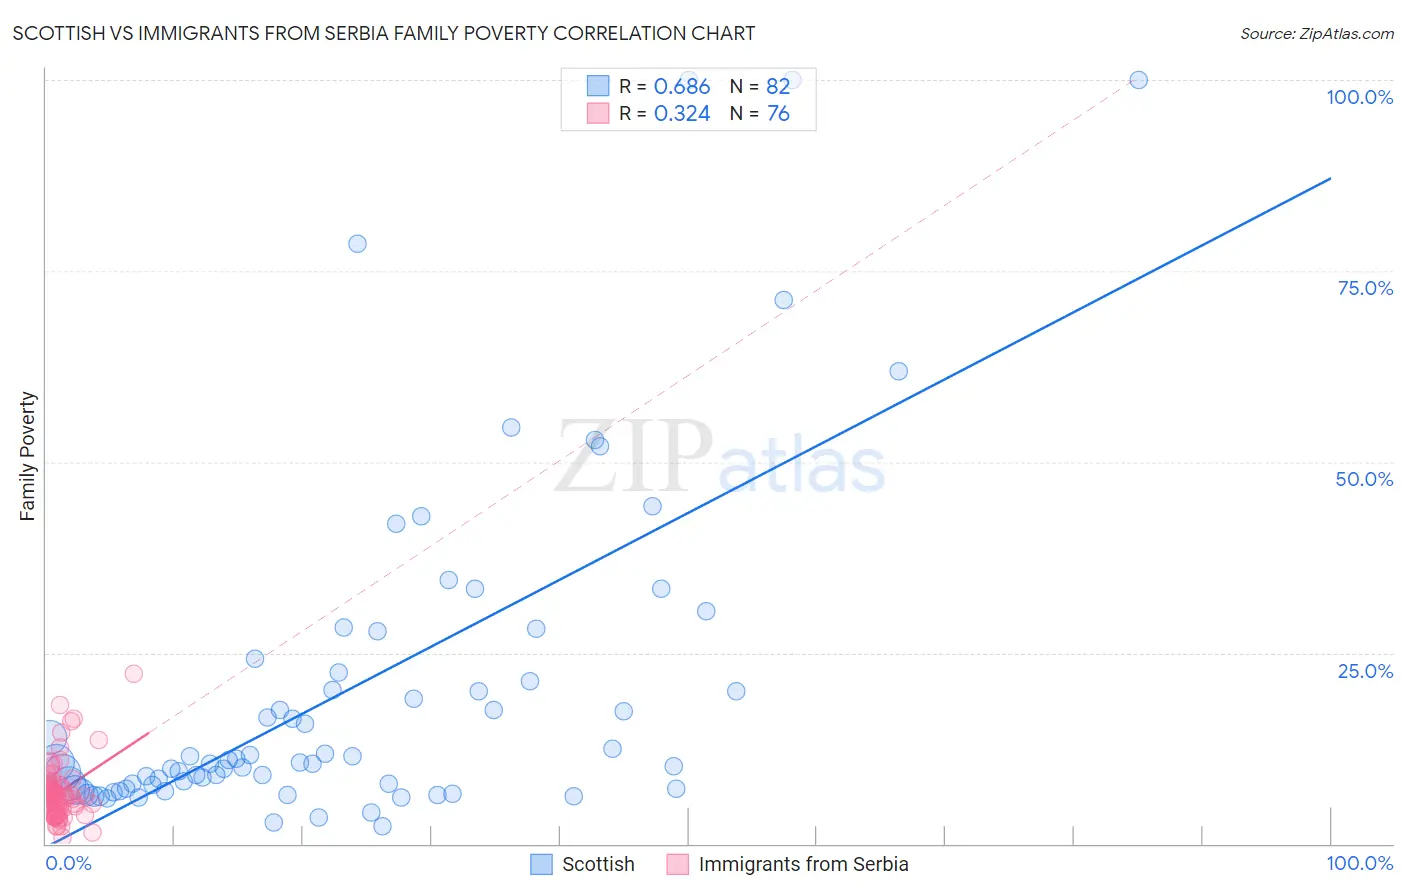
Scottish vs Immigrants from Serbia Family Poverty Correlation Chart
The statistical analysis conducted on geographies consisting of 562,331,846 people shows a significant positive correlation between the proportion of Scottish and poverty level among families in the United States with a correlation coefficient (R) of 0.686 and weighted average of 7.9%. Similarly, the statistical analysis conducted on geographies consisting of 131,659,331 people shows a mild positive correlation between the proportion of Immigrants from Serbia and poverty level among families in the United States with a correlation coefficient (R) of 0.324 and weighted average of 7.7%, a difference of 2.9%.
Family Poverty Correlation Summary
| Measurement | Scottish | Immigrants from Serbia |
| Minimum | 2.3% | 0.76% |
| Maximum | 100.0% | 22.2% |
| Range | 97.7% | 21.5% |
| Mean | 20.4% | 6.8% |
| Median | 10.7% | 6.3% |
| Interquartile 25% (IQ1) | 7.2% | 4.3% |
| Interquartile 75% (IQ3) | 22.4% | 7.5% |
| Interquartile Range (IQR) | 15.2% | 3.2% |
| Standard Deviation (Sample) | 22.2% | 3.8% |
| Standard Deviation (Population) | 22.1% | 3.8% |
Similar Demographics by Family Poverty
Demographics Similar to Scottish by Family Poverty
In terms of family poverty, the demographic groups most similar to Scottish are Immigrants from Asia (7.9%, a difference of 0.040%), Belgian (8.0%, a difference of 0.090%), Serbian (8.0%, a difference of 0.15%), British (7.9%, a difference of 0.29%), and Immigrants from Denmark (8.0%, a difference of 0.30%).
| Demographics | Rating | Rank | Family Poverty |
| Immigrants | Europe | 97.8 /100 | #79 | Exceptional 7.9% |
| English | 97.8 /100 | #80 | Exceptional 7.9% |
| Irish | 97.8 /100 | #81 | Exceptional 7.9% |
| Immigrants | Poland | 97.8 /100 | #82 | Exceptional 7.9% |
| Slovaks | 97.7 /100 | #83 | Exceptional 7.9% |
| British | 97.5 /100 | #84 | Exceptional 7.9% |
| Immigrants | Asia | 97.4 /100 | #85 | Exceptional 7.9% |
| Scottish | 97.3 /100 | #86 | Exceptional 7.9% |
| Belgians | 97.3 /100 | #87 | Exceptional 8.0% |
| Serbians | 97.2 /100 | #88 | Exceptional 8.0% |
| Immigrants | Denmark | 97.1 /100 | #89 | Exceptional 8.0% |
| Immigrants | England | 97.1 /100 | #90 | Exceptional 8.0% |
| Immigrants | Italy | 97.0 /100 | #91 | Exceptional 8.0% |
| Czechoslovakians | 96.8 /100 | #92 | Exceptional 8.0% |
| Tlingit-Haida | 96.7 /100 | #93 | Exceptional 8.0% |
Demographics Similar to Immigrants from Serbia by Family Poverty
In terms of family poverty, the demographic groups most similar to Immigrants from Serbia are Immigrants from Eastern Asia (7.7%, a difference of 0.040%), Immigrants from Sweden (7.7%, a difference of 0.070%), Swiss (7.7%, a difference of 0.080%), Asian (7.7%, a difference of 0.090%), and Finnish (7.7%, a difference of 0.12%).
| Demographics | Rating | Rank | Family Poverty |
| Immigrants | Bolivia | 98.9 /100 | #49 | Exceptional 7.7% |
| Immigrants | North Macedonia | 98.9 /100 | #50 | Exceptional 7.7% |
| Immigrants | Moldova | 98.8 /100 | #51 | Exceptional 7.7% |
| Indians (Asian) | 98.8 /100 | #52 | Exceptional 7.7% |
| Swiss | 98.8 /100 | #53 | Exceptional 7.7% |
| Immigrants | Sweden | 98.8 /100 | #54 | Exceptional 7.7% |
| Immigrants | Eastern Asia | 98.7 /100 | #55 | Exceptional 7.7% |
| Immigrants | Serbia | 98.7 /100 | #56 | Exceptional 7.7% |
| Asians | 98.7 /100 | #57 | Exceptional 7.7% |
| Finns | 98.7 /100 | #58 | Exceptional 7.7% |
| Europeans | 98.7 /100 | #59 | Exceptional 7.7% |
| Immigrants | Greece | 98.7 /100 | #60 | Exceptional 7.7% |
| Immigrants | Netherlands | 98.6 /100 | #61 | Exceptional 7.7% |
| Macedonians | 98.6 /100 | #62 | Exceptional 7.8% |
| Zimbabweans | 98.4 /100 | #63 | Exceptional 7.8% |