Salvadoran vs Immigrants from Italy Child Poverty Under the Age of 16

COMPARE

Salvadoran
Race
Ancestry
AfghanAfricanAlaska NativeAlaskan AthabascanAlbanianAleutAlsatianAmericanApacheArabArapahoArgentineanArmenianAssyrian/Chaldean/SyriacAustralianAustrianBahamianBangladeshiBarbadianBasqueBelgianBelizeanBermudanBhutaneseBlackfeetBolivianBrazilianBritishBritish West IndianBulgarianBurmeseCajunCambodianCanadianCape VerdeanCarpatho RusynCelticCentral AmericanCentral American IndianCherokeeCheyenneChickasawChileanChineseChippewaChoctawColombianColvilleComancheCosta RicanCreeCreekCroatianCrowCubanCypriotCzechCzechoslovakianDanishDelawareDominicanDutchDutch West IndianEastern EuropeanEcuadorianEgyptianEnglishEstonianEthiopianEuropeanFijianFilipinoFinnishFrenchFrench American IndianFrench CanadianGermanGerman RussianGhanaianGreekGuamanian/ChamorroGuatemalanGuyaneseHaitianHmongHonduranHopiHoumaHungarianIcelanderIndian (Asian)IndonesianInupiatIranianIraqiIrishIroquoisIsraeliItalianJamaicanJapaneseJordanianKenyanKiowaKoreanLaotianLatvianLebaneseLiberianLithuanianLumbeeLuxembourgerMacedonianMalaysianMalteseMarshalleseMenomineeMexicanMexican American IndianMongolianMoroccanNative HawaiianNavajoNepaleseNew ZealanderNicaraguanNigerianNorthern EuropeanNorwegianOkinawanOsageOttawaPaiutePakistaniPalestinianPanamanianParaguayanPennsylvania GermanPeruvianPimaPolishPortuguesePotawatomiPuebloPuerto RicanPuget Sound SalishRomanianRussianSalvadoranSamoanScandinavianScotch-IrishScottishSeminoleSenegaleseSerbianShoshoneSierra LeoneanSiouxSlavicSlovakSloveneSomaliSouth AfricanSouth AmericanSouth American IndianSoviet UnionSpaniardSpanishSpanish AmericanSpanish American IndianSri LankanSubsaharan AfricanSudaneseSwedishSwissSyrianTaiwaneseThaiTlingit-HaidaTohono O'OdhamTonganTrinidadian and TobagonianTsimshianTurkishU.S. Virgin IslanderUgandanUkrainianUruguayanUteVenezuelanVietnameseWelshWest IndianYakamaYaquiYugoslavianYumanYup'ikZimbabwean
Immigration
NonimmigrantsImmigrantsAfghanistanAfricaAlbaniaArgentinaArmeniaAsiaAustraliaAustriaBahamasBangladeshBarbadosBelarusBelgiumBelizeBoliviaBosnia and HerzegovinaBrazilBulgariaBurma/MyanmarCabo VerdeCambodiaCameroonCanadaCaribbeanCentral AmericaChileChinaColombiaCongoCosta RicaCroatiaCubaCzechoslovakiaDenmarkDominicaDominican RepublicEastern AfricaEastern AsiaEastern EuropeEcuadorEgyptEl SalvadorEnglandEritreaEthiopiaEuropeFijiFranceGermanyGhanaGreeceGrenadaGuatemalaGuyanaHaitiHondurasHong KongHungaryIndiaIndonesiaIranIraqIrelandIsraelJamaicaJapanJordanKazakhstanKenyaKoreaKuwaitLaosLatin AmericaLatviaLebanonLiberiaLithuaniaMalaysiaMexicoMicronesiaMiddle AfricaMoldovaMoroccoNepalNetherlandsNicaraguaNigeriaNorth AmericaNorth MacedoniaNorthern AfricaNorthern EuropeNorwayOceaniaPakistanPanamaPeruPhilippinesPolandPortugalRomaniaRussiaSaudi ArabiaScotlandSenegalSerbiaSierra LeoneSingaporeSomaliaSouth AfricaSouth AmericaSouth Central AsiaSouth Eastern AsiaSouthern EuropeSpainSri LankaSt. Vincent and the GrenadinesSudanSwedenSwitzerlandSyriaTaiwanThailandTrinidad and TobagoTurkeyUgandaUkraineUruguayUzbekistanVenezuelaVietnamWest IndiesWestern AfricaWestern AsiaWestern EuropeYemenZaireZimbabweAzores
Immigrants from Italy
Race
Ancestry
AfghanAfricanAlaska NativeAlaskan AthabascanAlbanianAleutAlsatianAmericanApacheArabArapahoArgentineanArmenianAssyrian/Chaldean/SyriacAustralianAustrianBahamianBangladeshiBarbadianBasqueBelgianBelizeanBermudanBhutaneseBlackfeetBolivianBrazilianBritishBritish West IndianBulgarianBurmeseCajunCambodianCanadianCape VerdeanCarpatho RusynCelticCentral AmericanCentral American IndianCherokeeCheyenneChickasawChileanChineseChippewaChoctawColombianColvilleComancheCosta RicanCreeCreekCroatianCrowCubanCypriotCzechCzechoslovakianDanishDelawareDominicanDutchDutch West IndianEastern EuropeanEcuadorianEgyptianEnglishEstonianEthiopianEuropeanFijianFilipinoFinnishFrenchFrench American IndianFrench CanadianGermanGerman RussianGhanaianGreekGuamanian/ChamorroGuatemalanGuyaneseHaitianHmongHonduranHopiHoumaHungarianIcelanderIndian (Asian)IndonesianInupiatIranianIraqiIrishIroquoisIsraeliItalianJamaicanJapaneseJordanianKenyanKiowaKoreanLaotianLatvianLebaneseLiberianLithuanianLumbeeLuxembourgerMacedonianMalaysianMalteseMarshalleseMenomineeMexicanMexican American IndianMongolianMoroccanNative HawaiianNavajoNepaleseNew ZealanderNicaraguanNigerianNorthern EuropeanNorwegianOkinawanOsageOttawaPaiutePakistaniPalestinianPanamanianParaguayanPennsylvania GermanPeruvianPimaPolishPortuguesePotawatomiPuebloPuerto RicanPuget Sound SalishRomanianRussianSamoanScandinavianScotch-IrishScottishSeminoleSenegaleseSerbianShoshoneSierra LeoneanSiouxSlavicSlovakSloveneSomaliSouth AfricanSouth AmericanSouth American IndianSoviet UnionSpaniardSpanishSpanish AmericanSpanish American IndianSri LankanSubsaharan AfricanSudaneseSwedishSwissSyrianTaiwaneseThaiTlingit-HaidaTohono O'OdhamTonganTrinidadian and TobagonianTsimshianTurkishU.S. Virgin IslanderUgandanUkrainianUruguayanUteVenezuelanVietnameseWelshWest IndianYakamaYaquiYugoslavianYumanYup'ikZimbabwean
Immigration
NonimmigrantsImmigrantsAfghanistanAfricaAlbaniaArgentinaArmeniaAsiaAustraliaAustriaBahamasBangladeshBarbadosBelarusBelgiumBelizeBoliviaBosnia and HerzegovinaBrazilBulgariaBurma/MyanmarCabo VerdeCambodiaCameroonCanadaCaribbeanCentral AmericaChileChinaColombiaCongoCosta RicaCroatiaCubaCzechoslovakiaDenmarkDominicaDominican RepublicEastern AfricaEastern AsiaEastern EuropeEcuadorEgyptEl SalvadorEnglandEritreaEthiopiaEuropeFijiFranceGermanyGhanaGreeceGrenadaGuatemalaGuyanaHaitiHondurasHong KongHungaryIndiaIndonesiaIranIraqIrelandIsraelItalyJamaicaJapanJordanKazakhstanKenyaKoreaKuwaitLaosLatin AmericaLatviaLebanonLiberiaLithuaniaMalaysiaMexicoMicronesiaMiddle AfricaMoldovaMoroccoNepalNetherlandsNicaraguaNigeriaNorth AmericaNorth MacedoniaNorthern AfricaNorthern EuropeNorwayOceaniaPakistanPanamaPeruPhilippinesPolandPortugalRomaniaRussiaSaudi ArabiaScotlandSenegalSerbiaSierra LeoneSingaporeSomaliaSouth AfricaSouth AmericaSouth Central AsiaSouth Eastern AsiaSouthern EuropeSpainSri LankaSt. Vincent and the GrenadinesSudanSwedenSwitzerlandSyriaTaiwanThailandTrinidad and TobagoTurkeyUgandaUkraineUruguayUzbekistanVenezuelaVietnamWest IndiesWestern AfricaWestern AsiaWestern EuropeYemenZaireZimbabweAzores
Child Poverty Under the Age of 16
Income
Poverty
Unemployment
Labor Participation
Family Structure
Vehicle Availability
Education Level
Disability

Child Poverty Under the Age of 16 Comparison

Salvadorans

Immigrants from Italy

Tragic
Exceptional
19.1%
CHILD POVERTY UNDER THE AGE OF 16
0.3/ 100
METRIC RATING
253rd/ 347
METRIC RANK
14.6%
CHILD POVERTY UNDER THE AGE OF 16
96.7/ 100
METRIC RATING
92nd/ 347
METRIC RANK

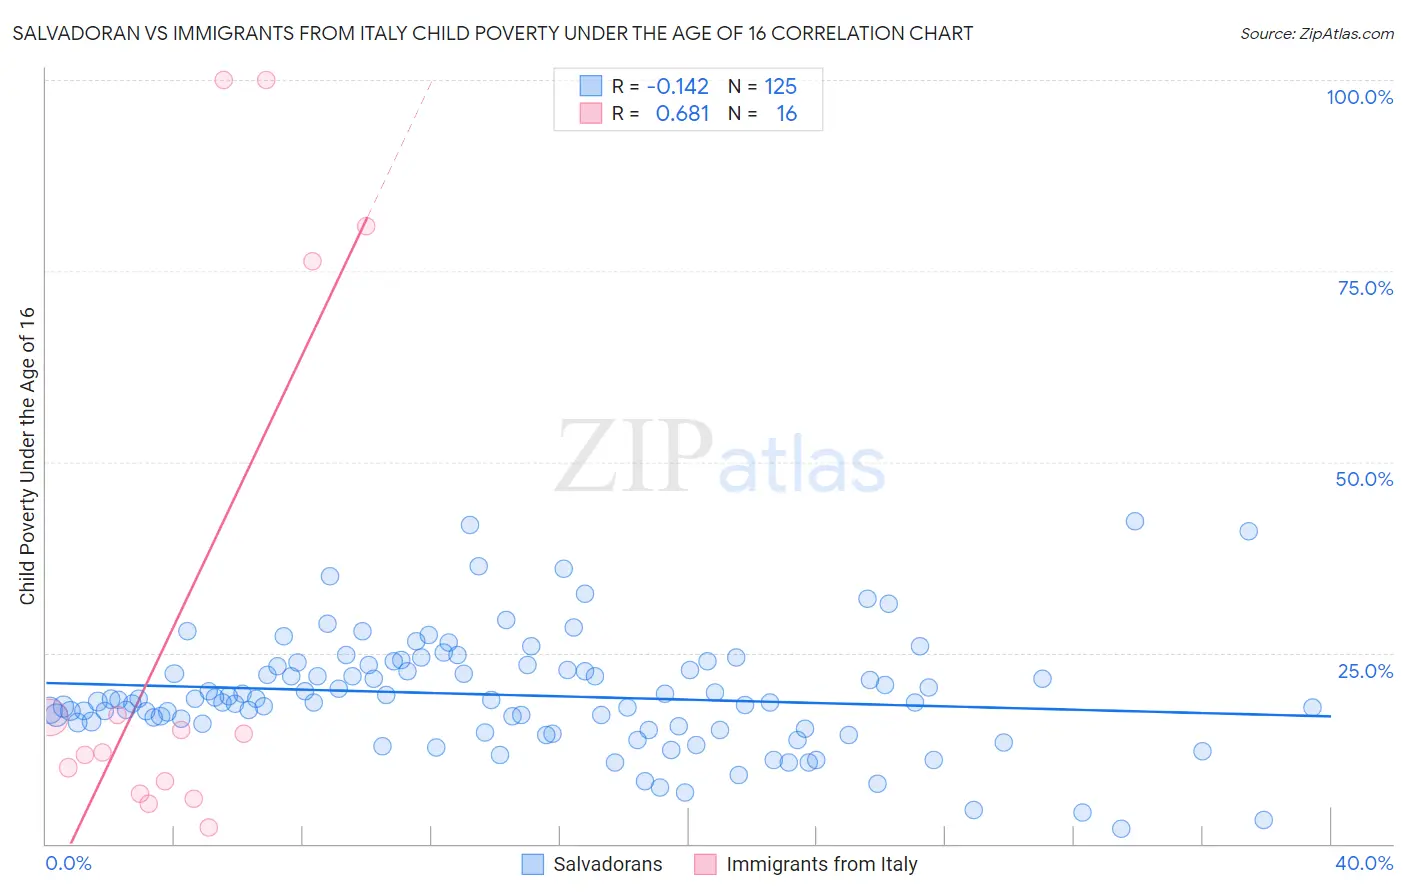
Salvadoran vs Immigrants from Italy Child Poverty Under the Age of 16 Correlation Chart

The statistical analysis conducted on geographies consisting of 396,509,971 people shows a poor negative correlation between the proportion of Salvadorans and poverty level among children under the age of 16 in the United States with a correlation coefficient (R) of -0.142 and weighted average of 19.1%. Similarly, the statistical analysis conducted on geographies consisting of 320,629,971 people shows a significant positive correlation between the proportion of Immigrants from Italy and poverty level among children under the age of 16 in the United States with a correlation coefficient (R) of 0.681 and weighted average of 14.6%, a difference of 31.2%.
Salvadoran vs Immigrants from Italy Child Poverty Under the Age of 16

Child Poverty Under the Age of 16 Correlation Summary

MeasurementSalvadoranImmigrants from Italy
Minimum1.9%2.2%
Maximum42.2%100.0%
Range40.3%97.8%
Mean19.5%30.1%
Median18.8%13.2%
Interquartile 25% (IQ1)15.2%7.3%
Interquartile 75% (IQ3)23.3%46.5%
Interquartile Range (IQR)8.1%39.2%
Standard Deviation (Sample)7.4%36.0%
Standard Deviation (Population)7.3%34.8%

Similar Demographics by Child Poverty Under the Age of 16

Demographics Similar to Salvadorans by Child Poverty Under the Age of 16

In terms of child poverty under the age of 16, the demographic groups most similar to Salvadorans are Immigrants from Trinidad and Tobago (19.1%, a difference of 0.19%), Immigrants from Western Africa (19.2%, a difference of 0.25%), Immigrants from Ghana (19.1%, a difference of 0.26%), Immigrants from Middle Africa (19.0%, a difference of 0.42%), and Trinidadian and Tobagonian (19.2%, a difference of 0.42%).
DemographicsRating | RankChild Poverty Under the Age of 16
Immigrants | Nicaragua
0.4
/100
|
#246
Tragic
18.8%
French American Indians
0.4
/100
|
#247
Tragic
18.9%
Ecuadorians
0.3
/100
|
#248
Tragic
19.0%
Potawatomi
0.3
/100
|
#249
Tragic
19.0%
Immigrants | Middle Africa
0.3
/100
|
#250
Tragic
19.0%
Immigrants | Ghana
0.3
/100
|
#251
Tragic
19.1%
Immigrants | Trinidad and Tobago
0.3
/100
|
#252
Tragic
19.1%
Salvadorans
0.3
/100
|
#253
Tragic
19.1%
Immigrants | Western Africa
0.2
/100
|
#254
Tragic
19.2%
Trinidadians and Tobagonians
0.2
/100
|
#255
Tragic
19.2%
Inupiat
0.2
/100
|
#256
Tragic
19.2%
Ottawa
0.2
/100
|
#257
Tragic
19.2%
Spanish Americans
0.2
/100
|
#258
Tragic
19.2%
Mexican American Indians
0.2
/100
|
#259
Tragic
19.3%
Guyanese
0.2
/100
|
#260
Tragic
19.3%

Demographics Similar to Immigrants from Italy by Child Poverty Under the Age of 16

In terms of child poverty under the age of 16, the demographic groups most similar to Immigrants from Italy are Immigrants from North America (14.6%, a difference of 0.030%), Argentinean (14.6%, a difference of 0.090%), Austrian (14.5%, a difference of 0.21%), German (14.5%, a difference of 0.28%), and Northern European (14.5%, a difference of 0.33%).
DemographicsRating | RankChild Poverty Under the Age of 16
Soviet Union
97.1
/100
|
#85
Exceptional
14.5%
Immigrants | Argentina
97.1
/100
|
#86
Exceptional
14.5%
Taiwanese
97.1
/100
|
#87
Exceptional
14.5%
Northern Europeans
97.0
/100
|
#88
Exceptional
14.5%
Germans
96.9
/100
|
#89
Exceptional
14.5%
Austrians
96.9
/100
|
#90
Exceptional
14.5%
Immigrants | North America
96.7
/100
|
#91
Exceptional
14.6%
Immigrants | Italy
96.7
/100
|
#92
Exceptional
14.6%
Argentineans
96.6
/100
|
#93
Exceptional
14.6%
Immigrants | South Africa
96.3
/100
|
#94
Exceptional
14.6%
Immigrants | Croatia
96.1
/100
|
#95
Exceptional
14.6%
Immigrants | France
95.8
/100
|
#96
Exceptional
14.7%
Paraguayans
95.7
/100
|
#97
Exceptional
14.7%
Immigrants | Belarus
95.7
/100
|
#98
Exceptional
14.7%
British
95.5
/100
|
#99
Exceptional
14.7%