Salvadoran vs Haitian Female Poverty Among 18-24 Year Olds
COMPARE
Salvadoran
Haitian
Female Poverty Among 18-24 Year Olds
Female Poverty Among 18-24 Year Olds Comparison
Salvadorans
Haitians
19.1%
FEMALE POVERTY AMONG 18-24 YEAR OLDS
98.4/ 100
METRIC RATING
97th/ 347
METRIC RANK
19.0%
FEMALE POVERTY AMONG 18-24 YEAR OLDS
98.9/ 100
METRIC RATING
93rd/ 347
METRIC RANK
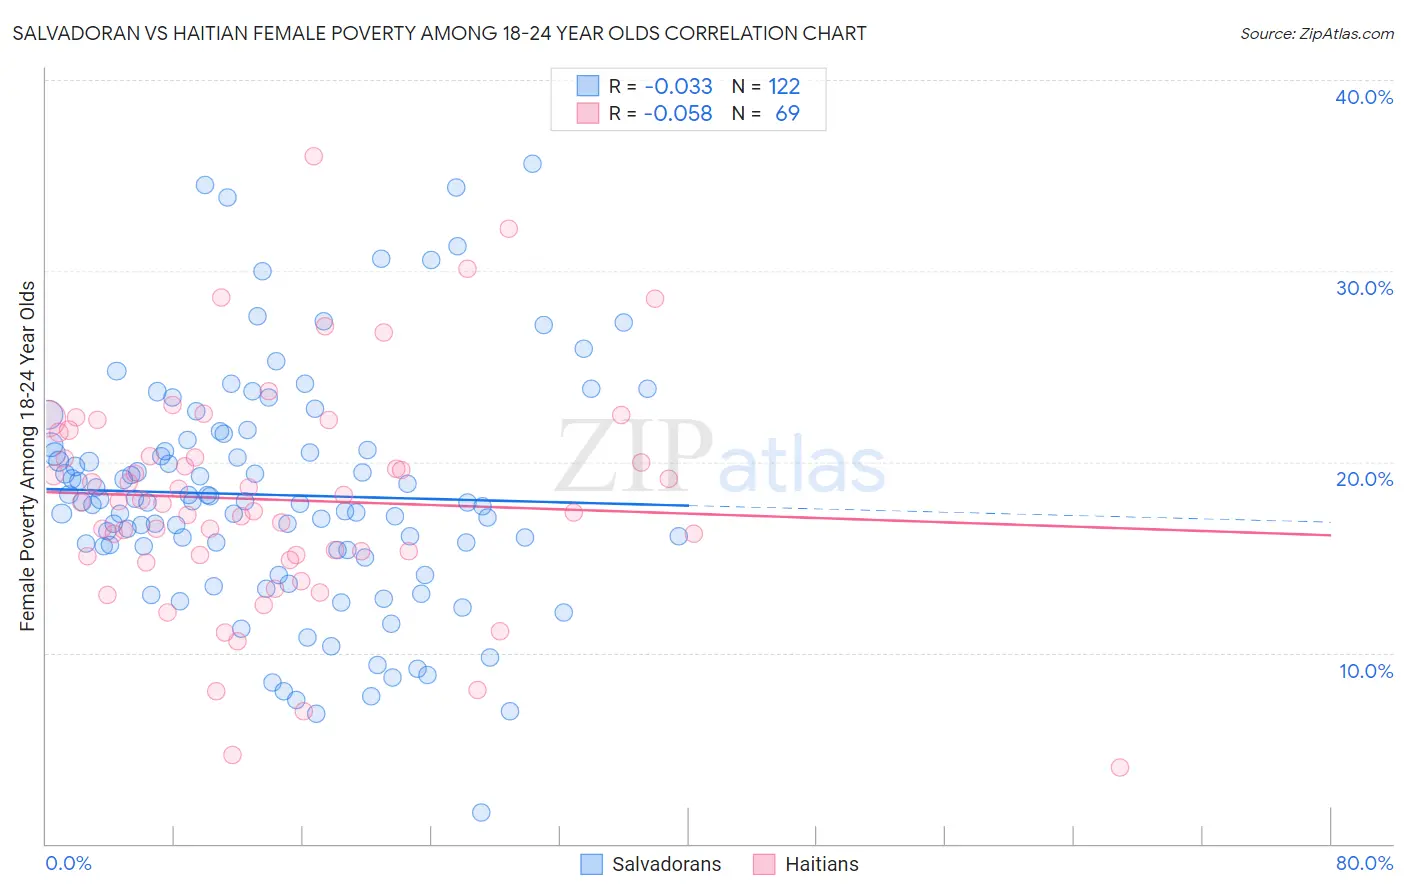
Salvadoran vs Haitian Female Poverty Among 18-24 Year Olds Correlation Chart
The statistical analysis conducted on geographies consisting of 390,935,430 people shows no correlation between the proportion of Salvadorans and poverty level among females between the ages 18 and 24 in the United States with a correlation coefficient (R) of -0.033 and weighted average of 19.1%. Similarly, the statistical analysis conducted on geographies consisting of 282,712,652 people shows a slight negative correlation between the proportion of Haitians and poverty level among females between the ages 18 and 24 in the United States with a correlation coefficient (R) of -0.058 and weighted average of 19.0%, a difference of 0.49%.
Female Poverty Among 18-24 Year Olds Correlation Summary
| Measurement | Salvadoran | Haitian |
| Minimum | 1.7% | 4.0% |
| Maximum | 35.6% | 36.0% |
| Range | 34.0% | 32.0% |
| Mean | 18.3% | 18.0% |
| Median | 17.9% | 17.9% |
| Interquartile 25% (IQ1) | 15.4% | 15.1% |
| Interquartile 75% (IQ3) | 20.9% | 20.9% |
| Interquartile Range (IQR) | 5.5% | 5.8% |
| Standard Deviation (Sample) | 6.2% | 5.9% |
| Standard Deviation (Population) | 6.1% | 5.9% |
Demographics Similar to Salvadorans and Haitians by Female Poverty Among 18-24 Year Olds
In terms of female poverty among 18-24 year olds, the demographic groups most similar to Salvadorans are Immigrants from Jordan (19.1%, a difference of 0.010%), Immigrants from Czechoslovakia (19.1%, a difference of 0.080%), Chilean (19.1%, a difference of 0.10%), Ecuadorian (19.1%, a difference of 0.19%), and Immigrants from Caribbean (19.1%, a difference of 0.21%). Similarly, the demographic groups most similar to Haitians are Filipino (19.0%, a difference of 0.030%), Ukrainian (19.0%, a difference of 0.060%), Romanian (19.0%, a difference of 0.070%), Guamanian/Chamorro (19.0%, a difference of 0.13%), and Afghan (19.0%, a difference of 0.17%).
| Demographics | Rating | Rank | Female Poverty Among 18-24 Year Olds |
| Immigrants | Armenia | 99.2 /100 | #85 | Exceptional 18.9% |
| Immigrants | Iraq | 99.2 /100 | #86 | Exceptional 18.9% |
| Immigrants | Jamaica | 99.2 /100 | #87 | Exceptional 18.9% |
| Croatians | 99.1 /100 | #88 | Exceptional 19.0% |
| Immigrants | Cabo Verde | 99.0 /100 | #89 | Exceptional 19.0% |
| Afghans | 99.0 /100 | #90 | Exceptional 19.0% |
| Romanians | 98.9 /100 | #91 | Exceptional 19.0% |
| Filipinos | 98.9 /100 | #92 | Exceptional 19.0% |
| Haitians | 98.9 /100 | #93 | Exceptional 19.0% |
| Ukrainians | 98.8 /100 | #94 | Exceptional 19.0% |
| Guamanians/Chamorros | 98.8 /100 | #95 | Exceptional 19.0% |
| Sierra Leoneans | 98.7 /100 | #96 | Exceptional 19.0% |
| Salvadorans | 98.4 /100 | #97 | Exceptional 19.1% |
| Immigrants | Jordan | 98.4 /100 | #98 | Exceptional 19.1% |
| Immigrants | Czechoslovakia | 98.3 /100 | #99 | Exceptional 19.1% |
| Chileans | 98.3 /100 | #100 | Exceptional 19.1% |
| Ecuadorians | 98.1 /100 | #101 | Exceptional 19.1% |
| Immigrants | Caribbean | 98.1 /100 | #102 | Exceptional 19.1% |
| Serbians | 98.0 /100 | #103 | Exceptional 19.1% |
| Immigrants | Afghanistan | 98.0 /100 | #104 | Exceptional 19.1% |
| Immigrants | Ecuador | 97.8 /100 | #105 | Exceptional 19.2% |