Russian vs Immigrants from Bosnia and Herzegovina Family Poverty

COMPARE

Russian
Race
Ancestry
AfghanAfricanAlaska NativeAlaskan AthabascanAlbanianAleutAlsatianAmericanApacheArabArapahoArgentineanArmenianAssyrian/Chaldean/SyriacAustralianAustrianBahamianBangladeshiBarbadianBasqueBelgianBelizeanBermudanBhutaneseBlackfeetBolivianBrazilianBritishBritish West IndianBulgarianBurmeseCajunCambodianCanadianCape VerdeanCarpatho RusynCelticCentral AmericanCentral American IndianCherokeeCheyenneChickasawChileanChineseChippewaChoctawColombianColvilleComancheCosta RicanCreeCreekCroatianCrowCubanCypriotCzechCzechoslovakianDanishDelawareDominicanDutchDutch West IndianEastern EuropeanEcuadorianEgyptianEnglishEstonianEthiopianEuropeanFijianFilipinoFinnishFrenchFrench American IndianFrench CanadianGermanGerman RussianGhanaianGreekGuamanian/ChamorroGuatemalanGuyaneseHaitianHmongHonduranHopiHoumaHungarianIcelanderIndian (Asian)IndonesianInupiatIranianIraqiIrishIroquoisIsraeliItalianJamaicanJapaneseJordanianKenyanKiowaKoreanLaotianLatvianLebaneseLiberianLithuanianLumbeeLuxembourgerMacedonianMalaysianMalteseMarshalleseMenomineeMexicanMexican American IndianMongolianMoroccanNative HawaiianNavajoNepaleseNew ZealanderNicaraguanNigerianNorthern EuropeanNorwegianOkinawanOsageOttawaPaiutePakistaniPalestinianPanamanianParaguayanPennsylvania GermanPeruvianPimaPolishPortuguesePotawatomiPuebloPuerto RicanPuget Sound SalishRomanianRussianSalvadoranSamoanScandinavianScotch-IrishScottishSeminoleSenegaleseSerbianShoshoneSierra LeoneanSiouxSlavicSlovakSloveneSomaliSouth AfricanSouth AmericanSouth American IndianSoviet UnionSpaniardSpanishSpanish AmericanSpanish American IndianSri LankanSubsaharan AfricanSudaneseSwedishSwissSyrianTaiwaneseThaiTlingit-HaidaTohono O'OdhamTonganTrinidadian and TobagonianTsimshianTurkishU.S. Virgin IslanderUgandanUkrainianUruguayanUteVenezuelanVietnameseWelshWest IndianYakamaYaquiYugoslavianYumanYup'ikZimbabwean
Immigration
NonimmigrantsImmigrantsAfghanistanAfricaAlbaniaArgentinaArmeniaAsiaAustraliaAustriaBahamasBangladeshBarbadosBelarusBelgiumBelizeBoliviaBrazilBulgariaBurma/MyanmarCabo VerdeCambodiaCameroonCanadaCaribbeanCentral AmericaChileChinaColombiaCongoCosta RicaCroatiaCubaCzechoslovakiaDenmarkDominicaDominican RepublicEastern AfricaEastern AsiaEastern EuropeEcuadorEgyptEl SalvadorEnglandEritreaEthiopiaEuropeFijiFranceGermanyGhanaGreeceGrenadaGuatemalaGuyanaHaitiHondurasHong KongHungaryIndiaIndonesiaIranIraqIrelandIsraelItalyJamaicaJapanJordanKazakhstanKenyaKoreaKuwaitLaosLatin AmericaLatviaLebanonLiberiaLithuaniaMalaysiaMexicoMicronesiaMiddle AfricaMoldovaMoroccoNepalNetherlandsNicaraguaNigeriaNorth AmericaNorth MacedoniaNorthern AfricaNorthern EuropeNorwayOceaniaPakistanPanamaPeruPhilippinesPolandPortugalRomaniaRussiaSaudi ArabiaScotlandSenegalSerbiaSierra LeoneSingaporeSomaliaSouth AfricaSouth AmericaSouth Central AsiaSouth Eastern AsiaSouthern EuropeSpainSri LankaSt. Vincent and the GrenadinesSudanSwedenSwitzerlandSyriaTaiwanThailandTrinidad and TobagoTurkeyUgandaUkraineUruguayUzbekistanVenezuelaVietnamWest IndiesWestern AfricaWestern AsiaWestern EuropeYemenZaireZimbabweAzores
Immigrants from Bosnia and Herzegovina
Race
Ancestry
AfghanAfricanAlaska NativeAlaskan AthabascanAlbanianAleutAlsatianAmericanApacheArabArapahoArgentineanArmenianAssyrian/Chaldean/SyriacAustralianAustrianBahamianBangladeshiBarbadianBasqueBelgianBelizeanBermudanBhutaneseBlackfeetBolivianBrazilianBritishBritish West IndianBulgarianBurmeseCajunCambodianCanadianCape VerdeanCarpatho RusynCelticCentral AmericanCentral American IndianCherokeeCheyenneChickasawChileanChineseChippewaChoctawColombianColvilleComancheCosta RicanCreeCreekCroatianCrowCubanCypriotCzechCzechoslovakianDanishDelawareDominicanDutchDutch West IndianEastern EuropeanEcuadorianEgyptianEnglishEstonianEthiopianEuropeanFijianFilipinoFinnishFrenchFrench American IndianFrench CanadianGermanGerman RussianGhanaianGreekGuamanian/ChamorroGuatemalanGuyaneseHaitianHmongHonduranHopiHoumaHungarianIcelanderIndian (Asian)IndonesianInupiatIranianIraqiIrishIroquoisIsraeliItalianJamaicanJapaneseJordanianKenyanKiowaKoreanLaotianLatvianLebaneseLiberianLithuanianLumbeeLuxembourgerMacedonianMalaysianMalteseMarshalleseMenomineeMexicanMexican American IndianMongolianMoroccanNative HawaiianNavajoNepaleseNew ZealanderNicaraguanNigerianNorthern EuropeanNorwegianOkinawanOsageOttawaPaiutePakistaniPalestinianPanamanianParaguayanPennsylvania GermanPeruvianPimaPolishPortuguesePotawatomiPuebloPuerto RicanPuget Sound SalishRomanianSalvadoranSamoanScandinavianScotch-IrishScottishSeminoleSenegaleseSerbianShoshoneSierra LeoneanSiouxSlavicSlovakSloveneSomaliSouth AfricanSouth AmericanSouth American IndianSoviet UnionSpaniardSpanishSpanish AmericanSpanish American IndianSri LankanSubsaharan AfricanSudaneseSwedishSwissSyrianTaiwaneseThaiTlingit-HaidaTohono O'OdhamTonganTrinidadian and TobagonianTsimshianTurkishU.S. Virgin IslanderUgandanUkrainianUruguayanUteVenezuelanVietnameseWelshWest IndianYakamaYaquiYugoslavianYumanYup'ikZimbabwean
Immigration
NonimmigrantsImmigrantsAfghanistanAfricaAlbaniaArgentinaArmeniaAsiaAustraliaAustriaBahamasBangladeshBarbadosBelarusBelgiumBelizeBoliviaBosnia and HerzegovinaBrazilBulgariaBurma/MyanmarCabo VerdeCambodiaCameroonCanadaCaribbeanCentral AmericaChileChinaColombiaCongoCosta RicaCroatiaCubaCzechoslovakiaDenmarkDominicaDominican RepublicEastern AfricaEastern AsiaEastern EuropeEcuadorEgyptEl SalvadorEnglandEritreaEthiopiaEuropeFijiFranceGermanyGhanaGreeceGrenadaGuatemalaGuyanaHaitiHondurasHong KongHungaryIndiaIndonesiaIranIraqIrelandIsraelItalyJamaicaJapanJordanKazakhstanKenyaKoreaKuwaitLaosLatin AmericaLatviaLebanonLiberiaLithuaniaMalaysiaMexicoMicronesiaMiddle AfricaMoldovaMoroccoNepalNetherlandsNicaraguaNigeriaNorth AmericaNorth MacedoniaNorthern AfricaNorthern EuropeNorwayOceaniaPakistanPanamaPeruPhilippinesPolandPortugalRomaniaRussiaSaudi ArabiaScotlandSenegalSerbiaSierra LeoneSingaporeSomaliaSouth AfricaSouth AmericaSouth Central AsiaSouth Eastern AsiaSouthern EuropeSpainSri LankaSt. Vincent and the GrenadinesSudanSwedenSwitzerlandSyriaTaiwanThailandTrinidad and TobagoTurkeyUgandaUkraineUruguayUzbekistanVenezuelaVietnamWest IndiesWestern AfricaWestern AsiaWestern EuropeYemenZaireZimbabweAzores
Family Poverty
Income
Poverty
Unemployment
Labor Participation
Family Structure
Vehicle Availability
Education Level
Disability

Family Poverty Comparison

Russians

Immigrants from Bosnia and Herzegovina

Exceptional
Excellent
7.5%
FAMILY POVERTY
99.5/ 100
METRIC RATING
34th/ 347
METRIC RANK
8.4%
FAMILY POVERTY
88.6/ 100
METRIC RATING
130th/ 347
METRIC RANK

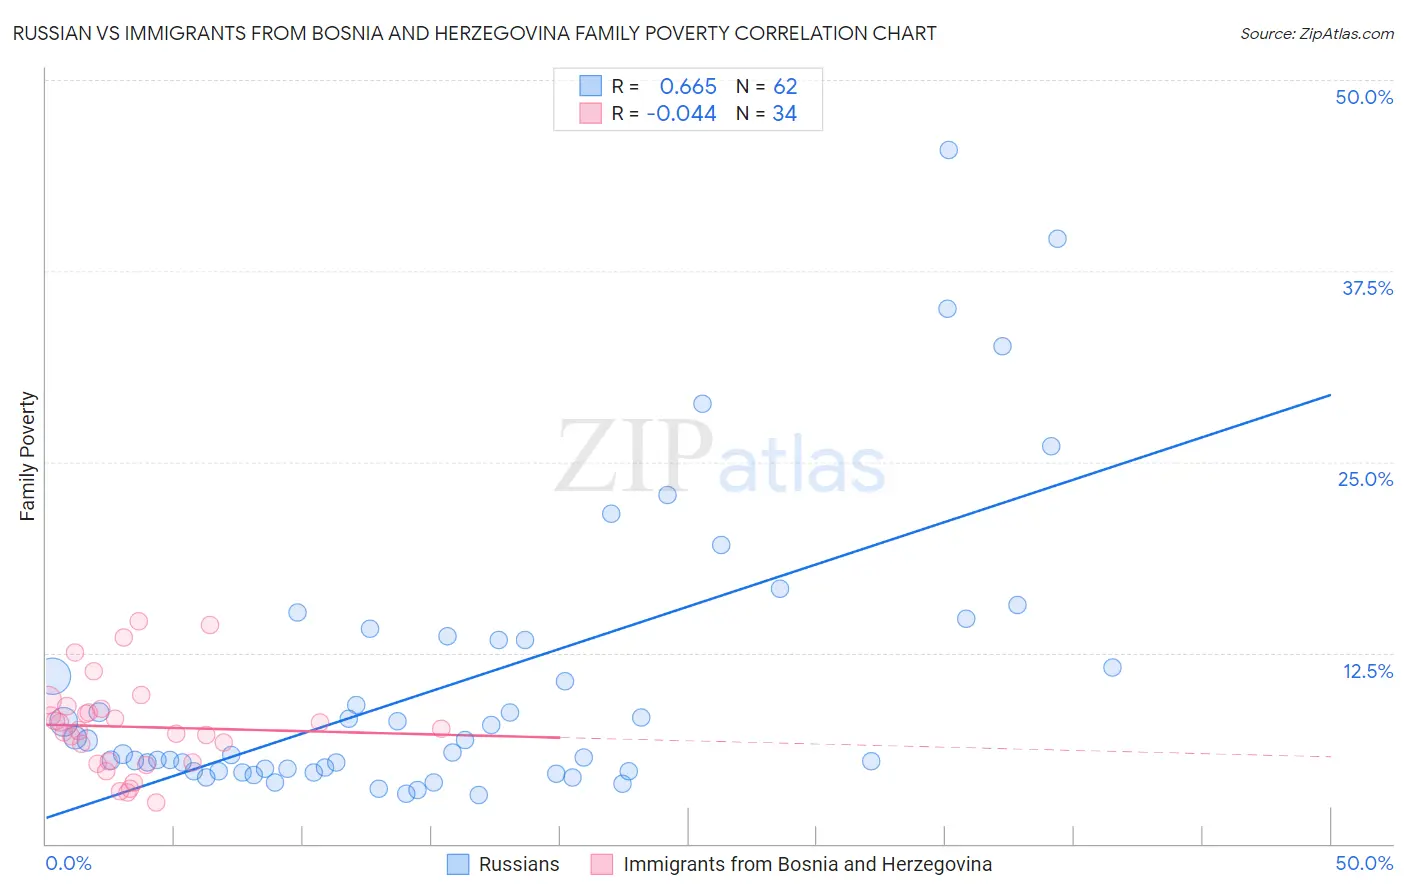
Russian vs Immigrants from Bosnia and Herzegovina Family Poverty Correlation Chart

The statistical analysis conducted on geographies consisting of 509,085,697 people shows a significant positive correlation between the proportion of Russians and poverty level among families in the United States with a correlation coefficient (R) of 0.665 and weighted average of 7.5%. Similarly, the statistical analysis conducted on geographies consisting of 156,590,681 people shows no correlation between the proportion of Immigrants from Bosnia and Herzegovina and poverty level among families in the United States with a correlation coefficient (R) of -0.044 and weighted average of 8.4%, a difference of 12.7%.
Russian vs Immigrants from Bosnia and Herzegovina Family Poverty

Family Poverty Correlation Summary

MeasurementRussianImmigrants from Bosnia and Herzegovina
Minimum3.2%2.7%
Maximum45.5%14.6%
Range42.3%11.9%
Mean10.6%7.7%
Median6.3%7.5%
Interquartile 25% (IQ1)4.8%5.3%
Interquartile 75% (IQ3)13.4%8.8%
Interquartile Range (IQR)8.6%3.5%
Standard Deviation (Sample)9.4%3.0%
Standard Deviation (Population)9.3%3.0%

Similar Demographics by Family Poverty

Demographics Similar to Russians by Family Poverty

In terms of family poverty, the demographic groups most similar to Russians are Polish (7.4%, a difference of 0.23%), Immigrants from Japan (7.4%, a difference of 0.23%), Czech (7.4%, a difference of 0.53%), Italian (7.4%, a difference of 0.65%), and Greek (7.5%, a difference of 0.73%).
DemographicsRating | RankFamily Poverty
Immigrants | Scotland
99.6
/100
|
#27
Exceptional
7.3%
Immigrants | Korea
99.6
/100
|
#28
Exceptional
7.4%
Immigrants | Northern Europe
99.6
/100
|
#29
Exceptional
7.4%
Italians
99.6
/100
|
#30
Exceptional
7.4%
Czechs
99.6
/100
|
#31
Exceptional
7.4%
Poles
99.5
/100
|
#32
Exceptional
7.4%
Immigrants | Japan
99.5
/100
|
#33
Exceptional
7.4%
Russians
99.5
/100
|
#34
Exceptional
7.5%
Greeks
99.4
/100
|
#35
Exceptional
7.5%
Turks
99.4
/100
|
#36
Exceptional
7.5%
Estonians
99.4
/100
|
#37
Exceptional
7.5%
Bolivians
99.3
/100
|
#38
Exceptional
7.5%
Carpatho Rusyns
99.3
/100
|
#39
Exceptional
7.5%
Slovenes
99.3
/100
|
#40
Exceptional
7.5%
Immigrants | Australia
99.2
/100
|
#41
Exceptional
7.6%

Demographics Similar to Immigrants from Bosnia and Herzegovina by Family Poverty

In terms of family poverty, the demographic groups most similar to Immigrants from Bosnia and Herzegovina are Puget Sound Salish (8.4%, a difference of 0.010%), Immigrants from Argentina (8.4%, a difference of 0.16%), Portuguese (8.4%, a difference of 0.18%), Argentinean (8.4%, a difference of 0.34%), and Immigrants from Hungary (8.4%, a difference of 0.48%).
DemographicsRating | RankFamily Poverty
Palestinians
91.1
/100
|
#123
Exceptional
8.3%
Soviet Union
90.8
/100
|
#124
Exceptional
8.3%
Pakistanis
90.8
/100
|
#125
Exceptional
8.3%
Icelanders
90.3
/100
|
#126
Exceptional
8.3%
Immigrants | Hungary
89.9
/100
|
#127
Excellent
8.4%
Argentineans
89.6
/100
|
#128
Excellent
8.4%
Portuguese
89.2
/100
|
#129
Excellent
8.4%
Immigrants | Bosnia and Herzegovina
88.6
/100
|
#130
Excellent
8.4%
Puget Sound Salish
88.6
/100
|
#131
Excellent
8.4%
Immigrants | Argentina
88.2
/100
|
#132
Excellent
8.4%
Sri Lankans
86.6
/100
|
#133
Excellent
8.5%
Chileans
86.6
/100
|
#134
Excellent
8.5%
Immigrants | Malaysia
86.5
/100
|
#135
Excellent
8.5%
Immigrants | Brazil
86.3
/100
|
#136
Excellent
8.5%
Immigrants | Southern Europe
86.0
/100
|
#137
Excellent
8.5%