Romanian vs Immigrants from Western Europe Single Female Poverty

COMPARE

Romanian
Race
Ancestry
AfghanAfricanAlaska NativeAlaskan AthabascanAlbanianAleutAlsatianAmericanApacheArabArapahoArgentineanArmenianAssyrian/Chaldean/SyriacAustralianAustrianBahamianBangladeshiBarbadianBasqueBelgianBelizeanBermudanBhutaneseBlackfeetBolivianBrazilianBritishBritish West IndianBulgarianBurmeseCajunCambodianCanadianCape VerdeanCarpatho RusynCelticCentral AmericanCentral American IndianCherokeeCheyenneChickasawChileanChineseChippewaChoctawColombianColvilleComancheCosta RicanCreeCreekCroatianCrowCubanCypriotCzechCzechoslovakianDanishDelawareDominicanDutchDutch West IndianEastern EuropeanEcuadorianEgyptianEnglishEstonianEthiopianEuropeanFijianFilipinoFinnishFrenchFrench American IndianFrench CanadianGermanGerman RussianGhanaianGreekGuamanian/ChamorroGuatemalanGuyaneseHaitianHmongHonduranHopiHoumaHungarianIcelanderIndian (Asian)IndonesianInupiatIranianIraqiIrishIroquoisIsraeliItalianJamaicanJapaneseJordanianKenyanKiowaKoreanLaotianLatvianLebaneseLiberianLithuanianLumbeeLuxembourgerMacedonianMalaysianMalteseMarshalleseMenomineeMexicanMexican American IndianMongolianMoroccanNative HawaiianNavajoNepaleseNew ZealanderNicaraguanNigerianNorthern EuropeanNorwegianOkinawanOsageOttawaPaiutePakistaniPalestinianPanamanianParaguayanPennsylvania GermanPeruvianPimaPolishPortuguesePotawatomiPuebloPuerto RicanPuget Sound SalishRomanianRussianSalvadoranSamoanScandinavianScotch-IrishScottishSeminoleSenegaleseSerbianShoshoneSierra LeoneanSiouxSlavicSlovakSloveneSomaliSouth AfricanSouth AmericanSouth American IndianSoviet UnionSpaniardSpanishSpanish AmericanSpanish American IndianSri LankanSubsaharan AfricanSudaneseSwedishSwissSyrianTaiwaneseThaiTlingit-HaidaTohono O'OdhamTonganTrinidadian and TobagonianTsimshianTurkishU.S. Virgin IslanderUgandanUkrainianUruguayanUteVenezuelanVietnameseWelshWest IndianYakamaYaquiYugoslavianYumanYup'ikZimbabwean
Immigration
NonimmigrantsImmigrantsAfghanistanAfricaAlbaniaArgentinaArmeniaAsiaAustraliaAustriaBahamasBangladeshBarbadosBelarusBelgiumBelizeBoliviaBosnia and HerzegovinaBrazilBulgariaBurma/MyanmarCabo VerdeCambodiaCameroonCanadaCaribbeanCentral AmericaChileChinaColombiaCongoCosta RicaCroatiaCubaCzechoslovakiaDenmarkDominicaDominican RepublicEastern AfricaEastern AsiaEastern EuropeEcuadorEgyptEl SalvadorEnglandEritreaEthiopiaEuropeFijiFranceGermanyGhanaGreeceGrenadaGuatemalaGuyanaHaitiHondurasHong KongHungaryIndiaIndonesiaIranIraqIrelandIsraelItalyJamaicaJapanJordanKazakhstanKenyaKoreaKuwaitLaosLatin AmericaLatviaLebanonLiberiaLithuaniaMalaysiaMexicoMicronesiaMiddle AfricaMoldovaMoroccoNepalNetherlandsNicaraguaNigeriaNorth AmericaNorth MacedoniaNorthern AfricaNorthern EuropeNorwayOceaniaPakistanPanamaPeruPhilippinesPolandPortugalRomaniaRussiaSaudi ArabiaScotlandSenegalSerbiaSierra LeoneSingaporeSomaliaSouth AfricaSouth AmericaSouth Central AsiaSouth Eastern AsiaSouthern EuropeSpainSri LankaSt. Vincent and the GrenadinesSudanSwedenSwitzerlandSyriaTaiwanThailandTrinidad and TobagoTurkeyUgandaUkraineUruguayUzbekistanVenezuelaVietnamWest IndiesWestern AfricaWestern AsiaYemenZaireZimbabweAzores
Immigrants from Western Europe
Race
Ancestry
AfghanAfricanAlaska NativeAlaskan AthabascanAlbanianAleutAlsatianAmericanApacheArabArapahoArgentineanArmenianAssyrian/Chaldean/SyriacAustralianAustrianBahamianBangladeshiBarbadianBasqueBelgianBelizeanBermudanBhutaneseBlackfeetBolivianBrazilianBritishBritish West IndianBulgarianBurmeseCajunCambodianCanadianCape VerdeanCarpatho RusynCelticCentral AmericanCentral American IndianCherokeeCheyenneChickasawChileanChineseChippewaChoctawColombianColvilleComancheCosta RicanCreeCreekCroatianCrowCubanCypriotCzechCzechoslovakianDanishDelawareDominicanDutchDutch West IndianEastern EuropeanEcuadorianEgyptianEnglishEstonianEthiopianEuropeanFijianFilipinoFinnishFrenchFrench American IndianFrench CanadianGermanGerman RussianGhanaianGreekGuamanian/ChamorroGuatemalanGuyaneseHaitianHmongHonduranHopiHoumaHungarianIcelanderIndian (Asian)IndonesianInupiatIranianIraqiIrishIroquoisIsraeliItalianJamaicanJapaneseJordanianKenyanKiowaKoreanLaotianLatvianLebaneseLiberianLithuanianLumbeeLuxembourgerMacedonianMalaysianMalteseMarshalleseMenomineeMexicanMexican American IndianMongolianMoroccanNative HawaiianNavajoNepaleseNew ZealanderNicaraguanNigerianNorthern EuropeanNorwegianOkinawanOsageOttawaPaiutePakistaniPalestinianPanamanianParaguayanPennsylvania GermanPeruvianPimaPolishPortuguesePotawatomiPuebloPuerto RicanPuget Sound SalishRussianSalvadoranSamoanScandinavianScotch-IrishScottishSeminoleSenegaleseSerbianShoshoneSierra LeoneanSiouxSlavicSlovakSloveneSomaliSouth AfricanSouth AmericanSouth American IndianSoviet UnionSpaniardSpanishSpanish AmericanSpanish American IndianSri LankanSubsaharan AfricanSudaneseSwedishSwissSyrianTaiwaneseThaiTlingit-HaidaTohono O'OdhamTonganTrinidadian and TobagonianTsimshianTurkishU.S. Virgin IslanderUgandanUkrainianUruguayanUteVenezuelanVietnameseWelshWest IndianYakamaYaquiYugoslavianYumanYup'ikZimbabwean
Immigration
NonimmigrantsImmigrantsAfghanistanAfricaAlbaniaArgentinaArmeniaAsiaAustraliaAustriaBahamasBangladeshBarbadosBelarusBelgiumBelizeBoliviaBosnia and HerzegovinaBrazilBulgariaBurma/MyanmarCabo VerdeCambodiaCameroonCanadaCaribbeanCentral AmericaChileChinaColombiaCongoCosta RicaCroatiaCubaCzechoslovakiaDenmarkDominicaDominican RepublicEastern AfricaEastern AsiaEastern EuropeEcuadorEgyptEl SalvadorEnglandEritreaEthiopiaEuropeFijiFranceGermanyGhanaGreeceGrenadaGuatemalaGuyanaHaitiHondurasHong KongHungaryIndiaIndonesiaIranIraqIrelandIsraelItalyJamaicaJapanJordanKazakhstanKenyaKoreaKuwaitLaosLatin AmericaLatviaLebanonLiberiaLithuaniaMalaysiaMexicoMicronesiaMiddle AfricaMoldovaMoroccoNepalNetherlandsNicaraguaNigeriaNorth AmericaNorth MacedoniaNorthern AfricaNorthern EuropeNorwayOceaniaPakistanPanamaPeruPhilippinesPolandPortugalRomaniaRussiaSaudi ArabiaScotlandSenegalSerbiaSierra LeoneSingaporeSomaliaSouth AfricaSouth AmericaSouth Central AsiaSouth Eastern AsiaSouthern EuropeSpainSri LankaSt. Vincent and the GrenadinesSudanSwedenSwitzerlandSyriaTaiwanThailandTrinidad and TobagoTurkeyUgandaUkraineUruguayUzbekistanVenezuelaVietnamWest IndiesWestern AfricaWestern AsiaWestern EuropeYemenZaireZimbabweAzores
Single Female Poverty
Income
Poverty
Unemployment
Labor Participation
Family Structure
Vehicle Availability
Education Level
Disability

Single Female Poverty Comparison

Romanians

Immigrants from Western Europe

Exceptional
Good
19.6%
SINGLE FEMALE POVERTY
98.6/ 100
METRIC RATING
94th/ 347
METRIC RANK
20.6%
SINGLE FEMALE POVERTY
76.7/ 100
METRIC RATING
154th/ 347
METRIC RANK

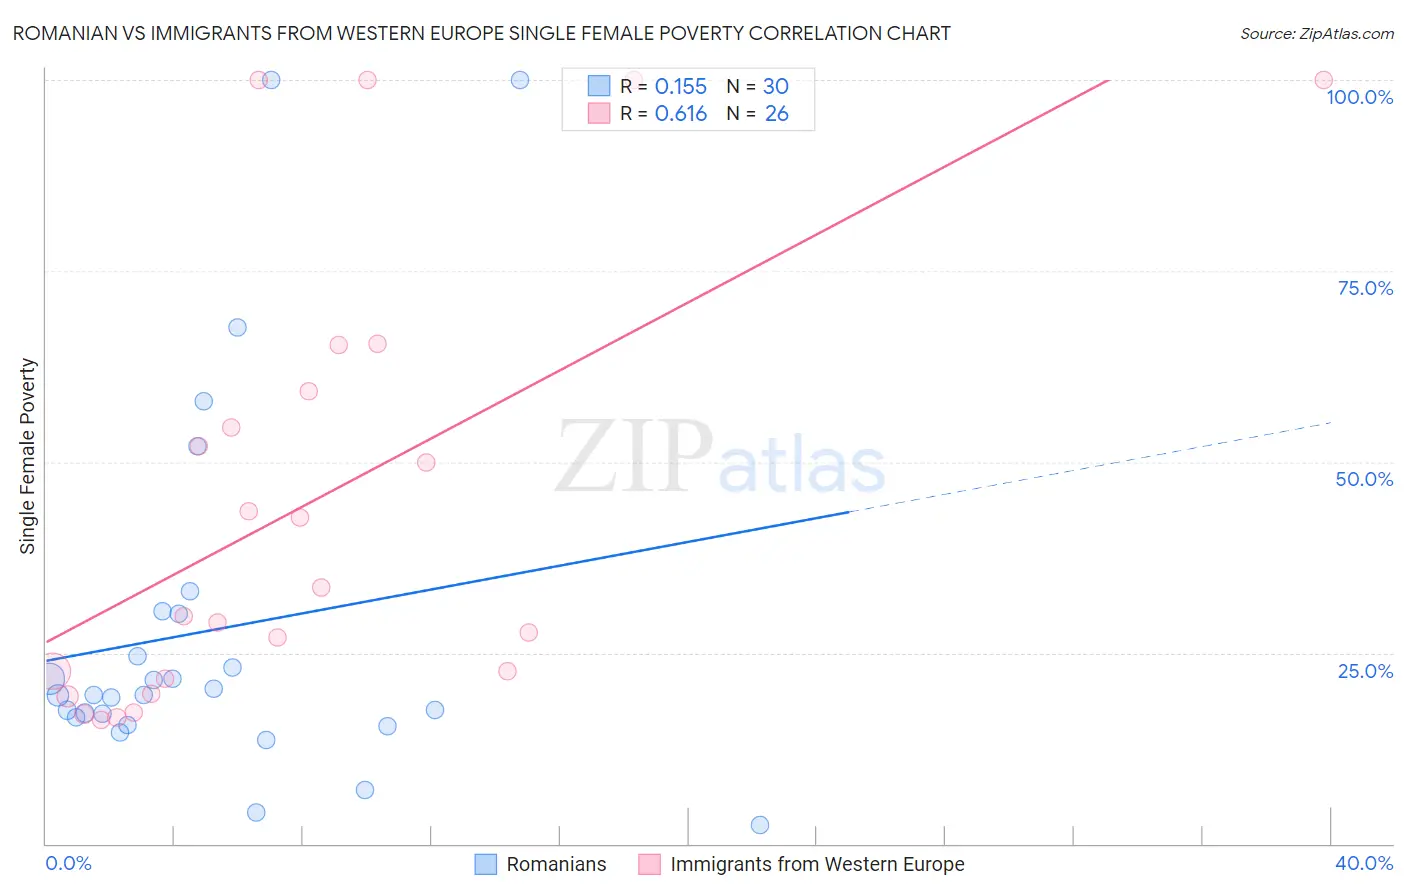
Romanian vs Immigrants from Western Europe Single Female Poverty Correlation Chart

The statistical analysis conducted on geographies consisting of 371,309,640 people shows a poor positive correlation between the proportion of Romanians and poverty level among single females in the United States with a correlation coefficient (R) of 0.155 and weighted average of 19.6%. Similarly, the statistical analysis conducted on geographies consisting of 482,241,585 people shows a significant positive correlation between the proportion of Immigrants from Western Europe and poverty level among single females in the United States with a correlation coefficient (R) of 0.616 and weighted average of 20.6%, a difference of 5.1%.
Romanian vs Immigrants from Western Europe Single Female Poverty

Single Female Poverty Correlation Summary

MeasurementRomanianImmigrants from Western Europe
Minimum2.5%16.2%
Maximum100.0%100.0%
Range97.5%83.8%
Mean28.0%44.3%
Median19.5%31.6%
Interquartile 25% (IQ1)16.6%21.6%
Interquartile 75% (IQ3)30.1%59.2%
Interquartile Range (IQR)13.5%37.6%
Standard Deviation (Sample)24.2%28.7%
Standard Deviation (Population)23.7%28.2%

Similar Demographics by Single Female Poverty

Demographics Similar to Romanians by Single Female Poverty

In terms of single female poverty, the demographic groups most similar to Romanians are Immigrants from Austria (19.6%, a difference of 0.22%), Italian (19.6%, a difference of 0.23%), Soviet Union (19.6%, a difference of 0.28%), Immigrants from Lebanon (19.6%, a difference of 0.34%), and Estonian (19.7%, a difference of 0.38%).
DemographicsRating | RankSingle Female Poverty
Zimbabweans
99.0
/100
|
#87
Exceptional
19.5%
Afghans
99.0
/100
|
#88
Exceptional
19.5%
Immigrants | Ukraine
99.0
/100
|
#89
Exceptional
19.5%
Immigrants | Lebanon
98.8
/100
|
#90
Exceptional
19.6%
Soviet Union
98.8
/100
|
#91
Exceptional
19.6%
Italians
98.8
/100
|
#92
Exceptional
19.6%
Immigrants | Austria
98.8
/100
|
#93
Exceptional
19.6%
Romanians
98.6
/100
|
#94
Exceptional
19.6%
Estonians
98.2
/100
|
#95
Exceptional
19.7%
Immigrants | Brazil
98.2
/100
|
#96
Exceptional
19.7%
Croatians
98.1
/100
|
#97
Exceptional
19.7%
Immigrants | France
97.9
/100
|
#98
Exceptional
19.7%
Sierra Leoneans
97.9
/100
|
#99
Exceptional
19.7%
Ukrainians
97.6
/100
|
#100
Exceptional
19.8%
Immigrants | Belgium
97.3
/100
|
#101
Exceptional
19.8%

Demographics Similar to Immigrants from Western Europe by Single Female Poverty

In terms of single female poverty, the demographic groups most similar to Immigrants from Western Europe are Swedish (20.6%, a difference of 0.030%), Samoan (20.6%, a difference of 0.060%), Immigrants from Uruguay (20.6%, a difference of 0.080%), South American Indian (20.6%, a difference of 0.10%), and Immigrants from Oceania (20.7%, a difference of 0.21%).
DemographicsRating | RankSingle Female Poverty
South Africans
85.3
/100
|
#147
Excellent
20.4%
Luxembourgers
84.9
/100
|
#148
Excellent
20.4%
Portuguese
81.5
/100
|
#149
Excellent
20.5%
Immigrants | Denmark
80.5
/100
|
#150
Excellent
20.5%
Puget Sound Salish
79.6
/100
|
#151
Good
20.6%
Immigrants | Uruguay
77.7
/100
|
#152
Good
20.6%
Swedes
77.1
/100
|
#153
Good
20.6%
Immigrants | Western Europe
76.7
/100
|
#154
Good
20.6%
Samoans
76.0
/100
|
#155
Good
20.6%
South American Indians
75.7
/100
|
#156
Good
20.6%
Immigrants | Oceania
74.3
/100
|
#157
Good
20.7%
Danes
73.0
/100
|
#158
Good
20.7%
Costa Ricans
71.8
/100
|
#159
Good
20.7%
Arabs
70.8
/100
|
#160
Good
20.7%
Kenyans
68.5
/100
|
#161
Good
20.8%