Romanian vs Brazilian Child Poverty Under the Age of 5

COMPARE

Romanian
Race
Ancestry
AfghanAfricanAlaska NativeAlaskan AthabascanAlbanianAleutAlsatianAmericanApacheArabArapahoArgentineanArmenianAssyrian/Chaldean/SyriacAustralianAustrianBahamianBangladeshiBarbadianBasqueBelgianBelizeanBermudanBhutaneseBlackfeetBolivianBritishBritish West IndianBulgarianBurmeseCajunCambodianCanadianCape VerdeanCarpatho RusynCelticCentral AmericanCentral American IndianCherokeeCheyenneChickasawChileanChineseChippewaChoctawColombianColvilleComancheCosta RicanCreeCreekCroatianCrowCubanCypriotCzechCzechoslovakianDanishDelawareDominicanDutchDutch West IndianEastern EuropeanEcuadorianEgyptianEnglishEstonianEthiopianEuropeanFijianFilipinoFinnishFrenchFrench American IndianFrench CanadianGermanGerman RussianGhanaianGreekGuamanian/ChamorroGuatemalanGuyaneseHaitianHmongHonduranHopiHoumaHungarianIcelanderIndian (Asian)IndonesianInupiatIranianIraqiIrishIroquoisIsraeliItalianJamaicanJapaneseJordanianKenyanKiowaKoreanLaotianLatvianLebaneseLiberianLithuanianLumbeeLuxembourgerMacedonianMalaysianMalteseMarshalleseMenomineeMexicanMexican American IndianMongolianMoroccanNative HawaiianNavajoNepaleseNew ZealanderNicaraguanNigerianNorthern EuropeanNorwegianOkinawanOsageOttawaPaiutePakistaniPalestinianPanamanianParaguayanPennsylvania GermanPeruvianPimaPolishPortuguesePotawatomiPuebloPuerto RicanPuget Sound SalishRomanianRussianSalvadoranSamoanScandinavianScotch-IrishScottishSeminoleSenegaleseSerbianShoshoneSierra LeoneanSiouxSlavicSlovakSloveneSomaliSouth AfricanSouth AmericanSouth American IndianSoviet UnionSpaniardSpanishSpanish AmericanSpanish American IndianSri LankanSubsaharan AfricanSudaneseSwedishSwissSyrianTaiwaneseThaiTlingit-HaidaTohono O'OdhamTonganTrinidadian and TobagonianTsimshianTurkishU.S. Virgin IslanderUgandanUkrainianUruguayanUteVenezuelanVietnameseWelshWest IndianYakamaYaquiYugoslavianYumanYup'ikZimbabwean
Immigration
NonimmigrantsImmigrantsAfghanistanAfricaAlbaniaArgentinaArmeniaAsiaAustraliaAustriaBahamasBangladeshBarbadosBelarusBelgiumBelizeBoliviaBosnia and HerzegovinaBrazilBulgariaBurma/MyanmarCabo VerdeCambodiaCameroonCanadaCaribbeanCentral AmericaChileChinaColombiaCongoCosta RicaCroatiaCubaCzechoslovakiaDenmarkDominicaDominican RepublicEastern AfricaEastern AsiaEastern EuropeEcuadorEgyptEl SalvadorEnglandEritreaEthiopiaEuropeFijiFranceGermanyGhanaGreeceGrenadaGuatemalaGuyanaHaitiHondurasHong KongHungaryIndiaIndonesiaIranIraqIrelandIsraelItalyJamaicaJapanJordanKazakhstanKenyaKoreaKuwaitLaosLatin AmericaLatviaLebanonLiberiaLithuaniaMalaysiaMexicoMicronesiaMiddle AfricaMoldovaMoroccoNepalNetherlandsNicaraguaNigeriaNorth AmericaNorth MacedoniaNorthern AfricaNorthern EuropeNorwayOceaniaPakistanPanamaPeruPhilippinesPolandPortugalRomaniaRussiaSaudi ArabiaScotlandSenegalSerbiaSierra LeoneSingaporeSomaliaSouth AfricaSouth AmericaSouth Central AsiaSouth Eastern AsiaSouthern EuropeSpainSri LankaSt. Vincent and the GrenadinesSudanSwedenSwitzerlandSyriaTaiwanThailandTrinidad and TobagoTurkeyUgandaUkraineUruguayUzbekistanVenezuelaVietnamWest IndiesWestern AfricaWestern AsiaWestern EuropeYemenZaireZimbabweAzores
Brazilian
Race
Ancestry
AfghanAfricanAlaska NativeAlaskan AthabascanAlbanianAleutAlsatianAmericanApacheArabArapahoArgentineanArmenianAssyrian/Chaldean/SyriacAustralianAustrianBahamianBangladeshiBarbadianBasqueBelgianBelizeanBermudanBhutaneseBlackfeetBolivianBrazilianBritishBritish West IndianBulgarianBurmeseCajunCambodianCanadianCape VerdeanCarpatho RusynCelticCentral AmericanCentral American IndianCherokeeCheyenneChickasawChileanChineseChippewaChoctawColombianColvilleComancheCosta RicanCreeCreekCroatianCrowCubanCypriotCzechCzechoslovakianDanishDelawareDominicanDutchDutch West IndianEastern EuropeanEcuadorianEgyptianEnglishEstonianEthiopianEuropeanFijianFilipinoFinnishFrenchFrench American IndianFrench CanadianGermanGerman RussianGhanaianGreekGuamanian/ChamorroGuatemalanGuyaneseHaitianHmongHonduranHopiHoumaHungarianIcelanderIndian (Asian)IndonesianInupiatIranianIraqiIrishIroquoisIsraeliItalianJamaicanJapaneseJordanianKenyanKiowaKoreanLaotianLatvianLebaneseLiberianLithuanianLumbeeLuxembourgerMacedonianMalaysianMalteseMarshalleseMenomineeMexicanMexican American IndianMongolianMoroccanNative HawaiianNavajoNepaleseNew ZealanderNicaraguanNigerianNorthern EuropeanNorwegianOkinawanOsageOttawaPaiutePakistaniPalestinianPanamanianParaguayanPennsylvania GermanPeruvianPimaPolishPortuguesePotawatomiPuebloPuerto RicanPuget Sound SalishRussianSalvadoranSamoanScandinavianScotch-IrishScottishSeminoleSenegaleseSerbianShoshoneSierra LeoneanSiouxSlavicSlovakSloveneSomaliSouth AfricanSouth AmericanSouth American IndianSoviet UnionSpaniardSpanishSpanish AmericanSpanish American IndianSri LankanSubsaharan AfricanSudaneseSwedishSwissSyrianTaiwaneseThaiTlingit-HaidaTohono O'OdhamTonganTrinidadian and TobagonianTsimshianTurkishU.S. Virgin IslanderUgandanUkrainianUruguayanUteVenezuelanVietnameseWelshWest IndianYakamaYaquiYugoslavianYumanYup'ikZimbabwean
Immigration
NonimmigrantsImmigrantsAfghanistanAfricaAlbaniaArgentinaArmeniaAsiaAustraliaAustriaBahamasBangladeshBarbadosBelarusBelgiumBelizeBoliviaBosnia and HerzegovinaBrazilBulgariaBurma/MyanmarCabo VerdeCambodiaCameroonCanadaCaribbeanCentral AmericaChileChinaColombiaCongoCosta RicaCroatiaCubaCzechoslovakiaDenmarkDominicaDominican RepublicEastern AfricaEastern AsiaEastern EuropeEcuadorEgyptEl SalvadorEnglandEritreaEthiopiaEuropeFijiFranceGermanyGhanaGreeceGrenadaGuatemalaGuyanaHaitiHondurasHong KongHungaryIndiaIndonesiaIranIraqIrelandIsraelItalyJamaicaJapanJordanKazakhstanKenyaKoreaKuwaitLaosLatin AmericaLatviaLebanonLiberiaLithuaniaMalaysiaMexicoMicronesiaMiddle AfricaMoldovaMoroccoNepalNetherlandsNicaraguaNigeriaNorth AmericaNorth MacedoniaNorthern AfricaNorthern EuropeNorwayOceaniaPakistanPanamaPeruPhilippinesPolandPortugalRomaniaRussiaSaudi ArabiaScotlandSenegalSerbiaSierra LeoneSingaporeSomaliaSouth AfricaSouth AmericaSouth Central AsiaSouth Eastern AsiaSouthern EuropeSpainSri LankaSt. Vincent and the GrenadinesSudanSwedenSwitzerlandSyriaTaiwanThailandTrinidad and TobagoTurkeyUgandaUkraineUruguayUzbekistanVenezuelaVietnamWest IndiesWestern AfricaWestern AsiaWestern EuropeYemenZaireZimbabweAzores
Child Poverty Under the Age of 5
Income
Poverty
Unemployment
Labor Participation
Family Structure
Vehicle Availability
Education Level
Disability

Child Poverty Under the Age of 5 Comparison

Romanians

Brazilians

Exceptional
Excellent
16.0%
CHILD POVERTY UNDER THE AGE OF 5
94.3/ 100
METRIC RATING
110th/ 347
METRIC RANK
16.4%
CHILD POVERTY UNDER THE AGE OF 5
87.8/ 100
METRIC RATING
135th/ 347
METRIC RANK

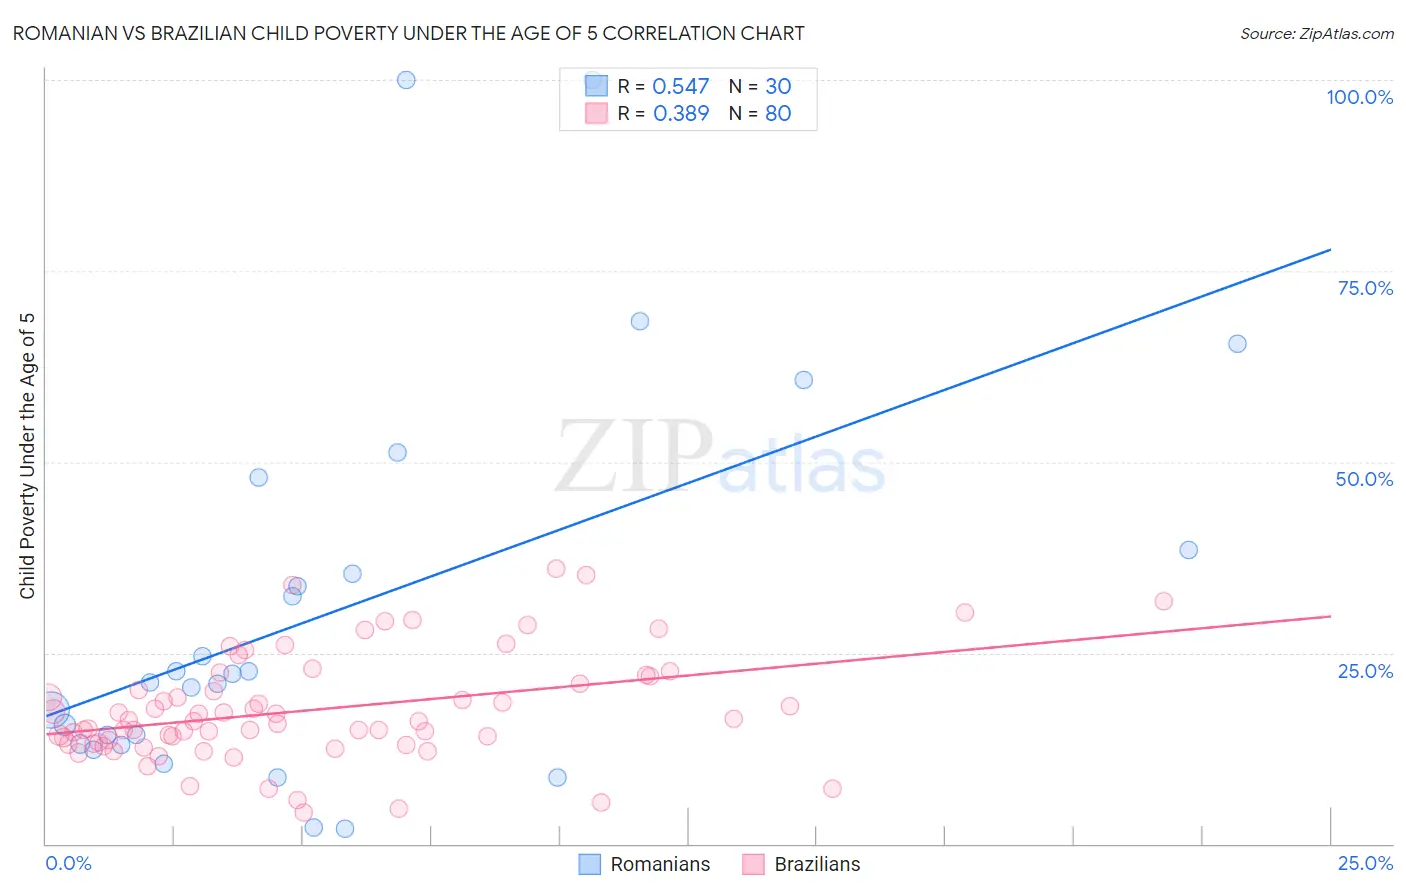
Romanian vs Brazilian Child Poverty Under the Age of 5 Correlation Chart

The statistical analysis conducted on geographies consisting of 360,104,252 people shows a substantial positive correlation between the proportion of Romanians and poverty level among children under the age of 5 in the United States with a correlation coefficient (R) of 0.547 and weighted average of 16.0%. Similarly, the statistical analysis conducted on geographies consisting of 312,012,194 people shows a mild positive correlation between the proportion of Brazilians and poverty level among children under the age of 5 in the United States with a correlation coefficient (R) of 0.389 and weighted average of 16.4%, a difference of 2.3%.
Romanian vs Brazilian Child Poverty Under the Age of 5

Child Poverty Under the Age of 5 Correlation Summary

MeasurementRomanianBrazilian
Minimum1.9%4.1%
Maximum100.0%36.1%
Range98.1%31.9%
Mean30.7%17.5%
Median21.7%16.1%
Interquartile 25% (IQ1)13.0%13.2%
Interquartile 75% (IQ3)38.5%21.5%
Interquartile Range (IQR)25.4%8.2%
Standard Deviation (Sample)25.9%7.0%
Standard Deviation (Population)25.4%7.0%

Similar Demographics by Child Poverty Under the Age of 5

Demographics Similar to Romanians by Child Poverty Under the Age of 5

In terms of child poverty under the age of 5, the demographic groups most similar to Romanians are Northern European (16.0%, a difference of 0.010%), Pakistani (16.0%, a difference of 0.040%), Immigrants from Brazil (16.0%, a difference of 0.090%), Peruvian (16.0%, a difference of 0.090%), and Slovene (16.0%, a difference of 0.10%).
DemographicsRating | RankChild Poverty Under the Age of 5
Europeans
95.3
/100
|
#103
Exceptional
15.9%
Immigrants | North America
94.9
/100
|
#104
Exceptional
15.9%
Immigrants | Spain
94.8
/100
|
#105
Exceptional
15.9%
Tlingit-Haida
94.7
/100
|
#106
Exceptional
15.9%
Slovenes
94.4
/100
|
#107
Exceptional
16.0%
Immigrants | Brazil
94.4
/100
|
#108
Exceptional
16.0%
Northern Europeans
94.3
/100
|
#109
Exceptional
16.0%
Romanians
94.3
/100
|
#110
Exceptional
16.0%
Pakistanis
94.2
/100
|
#111
Exceptional
16.0%
Peruvians
94.1
/100
|
#112
Exceptional
16.0%
Puget Sound Salish
94.1
/100
|
#113
Exceptional
16.0%
Immigrants | Kuwait
93.9
/100
|
#114
Exceptional
16.0%
Albanians
93.8
/100
|
#115
Exceptional
16.0%
Immigrants | Austria
93.5
/100
|
#116
Exceptional
16.0%
Basques
93.4
/100
|
#117
Exceptional
16.0%

Demographics Similar to Brazilians by Child Poverty Under the Age of 5

In terms of child poverty under the age of 5, the demographic groups most similar to Brazilians are Immigrants from North Macedonia (16.4%, a difference of 0.010%), Icelander (16.3%, a difference of 0.030%), Immigrants from Northern Africa (16.4%, a difference of 0.060%), Serbian (16.3%, a difference of 0.10%), and Finnish (16.3%, a difference of 0.13%).
DemographicsRating | RankChild Poverty Under the Age of 5
South Africans
90.1
/100
|
#128
Exceptional
16.2%
British
89.4
/100
|
#129
Excellent
16.3%
Immigrants | Norway
89.3
/100
|
#130
Excellent
16.3%
Finns
88.3
/100
|
#131
Excellent
16.3%
Serbians
88.2
/100
|
#132
Excellent
16.3%
Icelanders
87.9
/100
|
#133
Excellent
16.3%
Immigrants | North Macedonia
87.8
/100
|
#134
Excellent
16.4%
Brazilians
87.8
/100
|
#135
Excellent
16.4%
Immigrants | Northern Africa
87.5
/100
|
#136
Excellent
16.4%
Immigrants | Chile
85.3
/100
|
#137
Excellent
16.4%
Germans
84.8
/100
|
#138
Excellent
16.5%
Immigrants | Hungary
84.5
/100
|
#139
Excellent
16.5%
Guamanians/Chamorros
84.2
/100
|
#140
Excellent
16.5%
Immigrants | Western Europe
83.3
/100
|
#141
Excellent
16.5%
Portuguese
83.0
/100
|
#142
Excellent
16.5%