Puget Sound Salish vs Immigrants from France Family Poverty
COMPARE
Puget Sound Salish
Immigrants from France
Family Poverty
Family Poverty Comparison
Puget Sound Salish
Immigrants from France
8.4%
FAMILY POVERTY
88.6/ 100
METRIC RATING
131st/ 347
METRIC RANK
8.2%
FAMILY POVERTY
94.4/ 100
METRIC RATING
112th/ 347
METRIC RANK
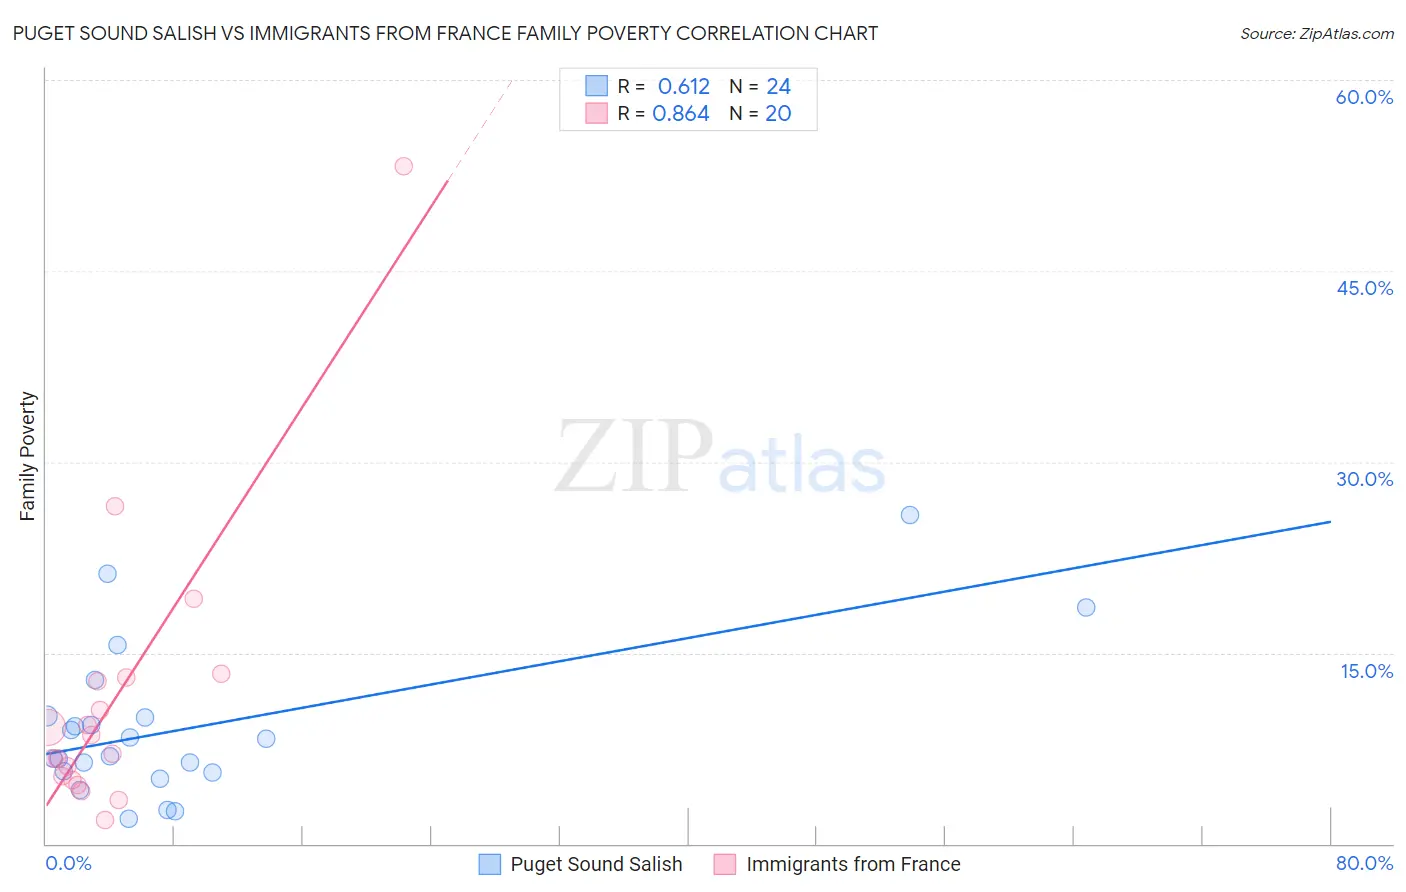
Puget Sound Salish vs Immigrants from France Family Poverty Correlation Chart
The statistical analysis conducted on geographies consisting of 46,127,030 people shows a significant positive correlation between the proportion of Puget Sound Salish and poverty level among families in the United States with a correlation coefficient (R) of 0.612 and weighted average of 8.4%. Similarly, the statistical analysis conducted on geographies consisting of 287,357,528 people shows a very strong positive correlation between the proportion of Immigrants from France and poverty level among families in the United States with a correlation coefficient (R) of 0.864 and weighted average of 8.2%, a difference of 2.8%.
Family Poverty Correlation Summary
| Measurement | Puget Sound Salish | Immigrants from France |
| Minimum | 2.0% | 1.9% |
| Maximum | 25.9% | 53.2% |
| Range | 23.9% | 51.3% |
| Mean | 9.1% | 11.3% |
| Median | 7.6% | 7.8% |
| Interquartile 25% (IQ1) | 5.7% | 5.2% |
| Interquartile 75% (IQ3) | 9.9% | 12.9% |
| Interquartile Range (IQR) | 4.3% | 7.7% |
| Standard Deviation (Sample) | 5.9% | 11.4% |
| Standard Deviation (Population) | 5.8% | 11.1% |
Demographics Similar to Puget Sound Salish and Immigrants from France by Family Poverty
In terms of family poverty, the demographic groups most similar to Puget Sound Salish are Immigrants from Bosnia and Herzegovina (8.4%, a difference of 0.010%), Portuguese (8.4%, a difference of 0.19%), Argentinean (8.4%, a difference of 0.35%), Immigrants from Hungary (8.4%, a difference of 0.49%), and Icelander (8.3%, a difference of 0.62%). Similarly, the demographic groups most similar to Immigrants from France are Taiwanese (8.2%, a difference of 0.11%), Canadian (8.2%, a difference of 0.17%), Immigrants from Zimbabwe (8.2%, a difference of 0.26%), Immigrants from Israel (8.2%, a difference of 0.61%), and South African (8.2%, a difference of 0.67%).
| Demographics | Rating | Rank | Family Poverty |
| Taiwanese | 94.6 /100 | #111 | Exceptional 8.2% |
| Immigrants | France | 94.4 /100 | #112 | Exceptional 8.2% |
| Canadians | 94.2 /100 | #113 | Exceptional 8.2% |
| Immigrants | Zimbabwe | 94.0 /100 | #114 | Exceptional 8.2% |
| Immigrants | Israel | 93.5 /100 | #115 | Exceptional 8.2% |
| South Africans | 93.4 /100 | #116 | Exceptional 8.2% |
| Immigrants | Russia | 93.2 /100 | #117 | Exceptional 8.2% |
| Immigrants | Western Europe | 92.9 /100 | #118 | Exceptional 8.2% |
| French | 92.8 /100 | #119 | Exceptional 8.3% |
| Immigrants | Egypt | 91.6 /100 | #120 | Exceptional 8.3% |
| Native Hawaiians | 91.3 /100 | #121 | Exceptional 8.3% |
| Paraguayans | 91.2 /100 | #122 | Exceptional 8.3% |
| Palestinians | 91.1 /100 | #123 | Exceptional 8.3% |
| Soviet Union | 90.8 /100 | #124 | Exceptional 8.3% |
| Pakistanis | 90.8 /100 | #125 | Exceptional 8.3% |
| Icelanders | 90.3 /100 | #126 | Exceptional 8.3% |
| Immigrants | Hungary | 89.9 /100 | #127 | Excellent 8.4% |
| Argentineans | 89.6 /100 | #128 | Excellent 8.4% |
| Portuguese | 89.2 /100 | #129 | Excellent 8.4% |
| Immigrants | Bosnia and Herzegovina | 88.6 /100 | #130 | Excellent 8.4% |
| Puget Sound Salish | 88.6 /100 | #131 | Excellent 8.4% |