Puerto Rican vs Immigrants from Armenia Family Poverty

COMPARE

Puerto Rican
Race
Ancestry
AfghanAfricanAlaska NativeAlaskan AthabascanAlbanianAleutAlsatianAmericanApacheArabArapahoArgentineanArmenianAssyrian/Chaldean/SyriacAustralianAustrianBahamianBangladeshiBarbadianBasqueBelgianBelizeanBermudanBhutaneseBlackfeetBolivianBrazilianBritishBritish West IndianBulgarianBurmeseCajunCambodianCanadianCape VerdeanCarpatho RusynCelticCentral AmericanCentral American IndianCherokeeCheyenneChickasawChileanChineseChippewaChoctawColombianColvilleComancheCosta RicanCreeCreekCroatianCrowCubanCypriotCzechCzechoslovakianDanishDelawareDominicanDutchDutch West IndianEastern EuropeanEcuadorianEgyptianEnglishEstonianEthiopianEuropeanFijianFilipinoFinnishFrenchFrench American IndianFrench CanadianGermanGerman RussianGhanaianGreekGuamanian/ChamorroGuatemalanGuyaneseHaitianHmongHonduranHopiHoumaHungarianIcelanderIndian (Asian)IndonesianInupiatIranianIraqiIrishIroquoisIsraeliItalianJamaicanJapaneseJordanianKenyanKiowaKoreanLaotianLatvianLebaneseLiberianLithuanianLumbeeLuxembourgerMacedonianMalaysianMalteseMarshalleseMenomineeMexicanMexican American IndianMongolianMoroccanNative HawaiianNavajoNepaleseNew ZealanderNicaraguanNigerianNorthern EuropeanNorwegianOkinawanOsageOttawaPaiutePakistaniPalestinianPanamanianParaguayanPennsylvania GermanPeruvianPimaPolishPortuguesePotawatomiPuebloPuerto RicanPuget Sound SalishRomanianRussianSalvadoranSamoanScandinavianScotch-IrishScottishSeminoleSenegaleseSerbianShoshoneSierra LeoneanSiouxSlavicSlovakSloveneSomaliSouth AfricanSouth AmericanSouth American IndianSoviet UnionSpaniardSpanishSpanish AmericanSpanish American IndianSri LankanSubsaharan AfricanSudaneseSwedishSwissSyrianTaiwaneseThaiTlingit-HaidaTohono O'OdhamTonganTrinidadian and TobagonianTsimshianTurkishU.S. Virgin IslanderUgandanUkrainianUruguayanUteVenezuelanVietnameseWelshWest IndianYakamaYaquiYugoslavianYumanYup'ikZimbabwean
Immigration
NonimmigrantsImmigrantsAfghanistanAfricaAlbaniaArgentinaAsiaAustraliaAustriaBahamasBangladeshBarbadosBelarusBelgiumBelizeBoliviaBosnia and HerzegovinaBrazilBulgariaBurma/MyanmarCabo VerdeCambodiaCameroonCanadaCaribbeanCentral AmericaChileChinaColombiaCongoCosta RicaCroatiaCubaCzechoslovakiaDenmarkDominicaDominican RepublicEastern AfricaEastern AsiaEastern EuropeEcuadorEgyptEl SalvadorEnglandEritreaEthiopiaEuropeFijiFranceGermanyGhanaGreeceGrenadaGuatemalaGuyanaHaitiHondurasHong KongHungaryIndiaIndonesiaIranIraqIrelandIsraelItalyJamaicaJapanJordanKazakhstanKenyaKoreaKuwaitLaosLatin AmericaLatviaLebanonLiberiaLithuaniaMalaysiaMexicoMicronesiaMiddle AfricaMoldovaMoroccoNepalNetherlandsNicaraguaNigeriaNorth AmericaNorth MacedoniaNorthern AfricaNorthern EuropeNorwayOceaniaPakistanPanamaPeruPhilippinesPolandPortugalRomaniaRussiaSaudi ArabiaScotlandSenegalSerbiaSierra LeoneSingaporeSomaliaSouth AfricaSouth AmericaSouth Central AsiaSouth Eastern AsiaSouthern EuropeSpainSri LankaSt. Vincent and the GrenadinesSudanSwedenSwitzerlandSyriaTaiwanThailandTrinidad and TobagoTurkeyUgandaUkraineUruguayUzbekistanVenezuelaVietnamWest IndiesWestern AfricaWestern AsiaWestern EuropeYemenZaireZimbabweAzores
Immigrants from Armenia
Race
Ancestry
AfghanAfricanAlaska NativeAlaskan AthabascanAlbanianAleutAlsatianAmericanApacheArabArapahoArgentineanArmenianAssyrian/Chaldean/SyriacAustralianAustrianBahamianBangladeshiBarbadianBasqueBelgianBelizeanBermudanBhutaneseBlackfeetBolivianBrazilianBritishBritish West IndianBulgarianBurmeseCajunCambodianCanadianCape VerdeanCarpatho RusynCelticCentral AmericanCentral American IndianCherokeeCheyenneChickasawChileanChineseChippewaChoctawColombianColvilleComancheCosta RicanCreeCreekCroatianCrowCubanCypriotCzechCzechoslovakianDanishDelawareDominicanDutchDutch West IndianEastern EuropeanEcuadorianEgyptianEnglishEstonianEthiopianEuropeanFijianFilipinoFinnishFrenchFrench American IndianFrench CanadianGermanGerman RussianGhanaianGreekGuamanian/ChamorroGuatemalanGuyaneseHaitianHmongHonduranHopiHoumaHungarianIcelanderIndian (Asian)IndonesianInupiatIranianIraqiIrishIroquoisIsraeliItalianJamaicanJapaneseJordanianKenyanKiowaKoreanLaotianLatvianLebaneseLiberianLithuanianLumbeeLuxembourgerMacedonianMalaysianMalteseMarshalleseMenomineeMexicanMexican American IndianMongolianMoroccanNative HawaiianNavajoNepaleseNew ZealanderNicaraguanNigerianNorthern EuropeanNorwegianOkinawanOsageOttawaPaiutePakistaniPalestinianPanamanianParaguayanPennsylvania GermanPeruvianPimaPolishPortuguesePotawatomiPuebloPuget Sound SalishRomanianRussianSalvadoranSamoanScandinavianScotch-IrishScottishSeminoleSenegaleseSerbianShoshoneSierra LeoneanSiouxSlavicSlovakSloveneSomaliSouth AfricanSouth AmericanSouth American IndianSoviet UnionSpaniardSpanishSpanish AmericanSpanish American IndianSri LankanSubsaharan AfricanSudaneseSwedishSwissSyrianTaiwaneseThaiTlingit-HaidaTohono O'OdhamTonganTrinidadian and TobagonianTsimshianTurkishU.S. Virgin IslanderUgandanUkrainianUruguayanUteVenezuelanVietnameseWelshWest IndianYakamaYaquiYugoslavianYumanYup'ikZimbabwean
Immigration
NonimmigrantsImmigrantsAfghanistanAfricaAlbaniaArgentinaArmeniaAsiaAustraliaAustriaBahamasBangladeshBarbadosBelarusBelgiumBelizeBoliviaBosnia and HerzegovinaBrazilBulgariaBurma/MyanmarCabo VerdeCambodiaCameroonCanadaCaribbeanCentral AmericaChileChinaColombiaCongoCosta RicaCroatiaCubaCzechoslovakiaDenmarkDominicaDominican RepublicEastern AfricaEastern AsiaEastern EuropeEcuadorEgyptEl SalvadorEnglandEritreaEthiopiaEuropeFijiFranceGermanyGhanaGreeceGrenadaGuatemalaGuyanaHaitiHondurasHong KongHungaryIndiaIndonesiaIranIraqIrelandIsraelItalyJamaicaJapanJordanKazakhstanKenyaKoreaKuwaitLaosLatin AmericaLatviaLebanonLiberiaLithuaniaMalaysiaMexicoMicronesiaMiddle AfricaMoldovaMoroccoNepalNetherlandsNicaraguaNigeriaNorth AmericaNorth MacedoniaNorthern AfricaNorthern EuropeNorwayOceaniaPakistanPanamaPeruPhilippinesPolandPortugalRomaniaRussiaSaudi ArabiaScotlandSenegalSerbiaSierra LeoneSingaporeSomaliaSouth AfricaSouth AmericaSouth Central AsiaSouth Eastern AsiaSouthern EuropeSpainSri LankaSt. Vincent and the GrenadinesSudanSwedenSwitzerlandSyriaTaiwanThailandTrinidad and TobagoTurkeyUgandaUkraineUruguayUzbekistanVenezuelaVietnamWest IndiesWestern AfricaWestern AsiaWestern EuropeYemenZaireZimbabweAzores
Family Poverty
Income
Poverty
Unemployment
Labor Participation
Family Structure
Vehicle Availability
Education Level
Disability

Family Poverty Comparison

Puerto Ricans

Immigrants from Armenia

Tragic
Tragic
20.3%
FAMILY POVERTY
0.0/ 100
METRIC RATING
346th/ 347
METRIC RANK
10.0%
FAMILY POVERTY
3.3/ 100
METRIC RATING
227th/ 347
METRIC RANK

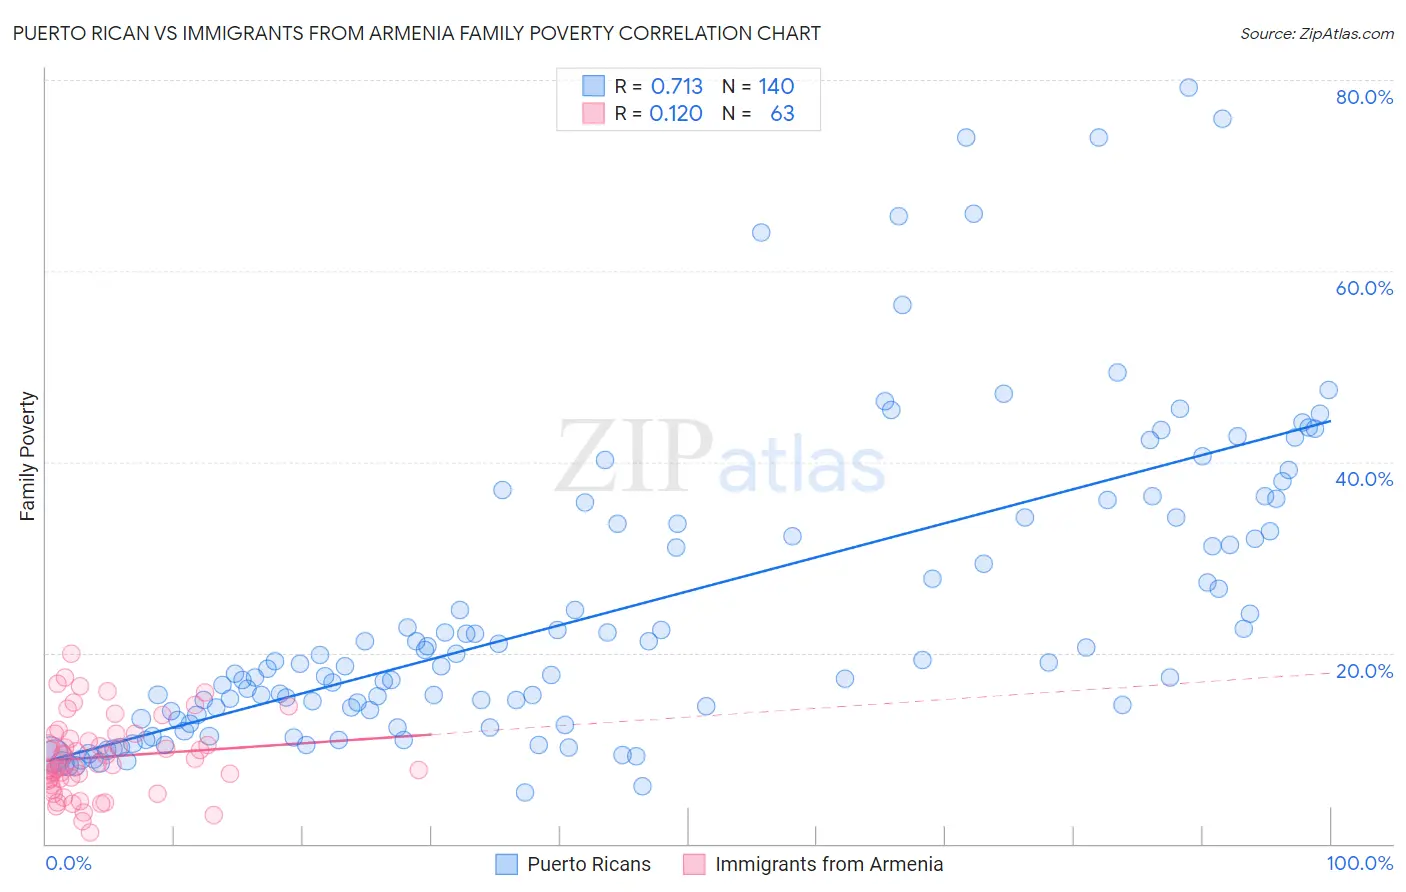
Puerto Rican vs Immigrants from Armenia Family Poverty Correlation Chart

The statistical analysis conducted on geographies consisting of 525,427,340 people shows a strong positive correlation between the proportion of Puerto Ricans and poverty level among families in the United States with a correlation coefficient (R) of 0.713 and weighted average of 20.3%. Similarly, the statistical analysis conducted on geographies consisting of 97,632,131 people shows a poor positive correlation between the proportion of Immigrants from Armenia and poverty level among families in the United States with a correlation coefficient (R) of 0.120 and weighted average of 10.0%, a difference of 103.2%.
Puerto Rican vs Immigrants from Armenia Family Poverty

Family Poverty Correlation Summary

MeasurementPuerto RicanImmigrants from Armenia
Minimum5.3%1.2%
Maximum79.2%19.9%
Range73.9%18.6%
Mean24.4%9.1%
Median18.7%8.3%
Interquartile 25% (IQ1)13.3%6.7%
Interquartile 75% (IQ3)33.5%11.5%
Interquartile Range (IQR)20.2%4.8%
Standard Deviation (Sample)15.9%4.1%
Standard Deviation (Population)15.9%4.0%

Similar Demographics by Family Poverty

Demographics Similar to Puerto Ricans by Family Poverty

In terms of family poverty, the demographic groups most similar to Puerto Ricans are Tohono O'odham (20.4%, a difference of 0.37%), Navajo (18.8%, a difference of 8.1%), Yup'ik (18.7%, a difference of 8.6%), Pima (18.4%, a difference of 10.6%), and Immigrants from Yemen (17.5%, a difference of 16.4%).
DemographicsRating | RankFamily Poverty
Immigrants | Dominican Republic
0.0
/100
|
#333
Tragic
14.4%
Houma
0.0
/100
|
#334
Tragic
14.6%
Apache
0.0
/100
|
#335
Tragic
14.7%
Sioux
0.0
/100
|
#336
Tragic
15.9%
Hopi
0.0
/100
|
#337
Tragic
15.9%
Crow
0.0
/100
|
#338
Tragic
16.1%
Yuman
0.0
/100
|
#339
Tragic
16.6%
Pueblo
0.0
/100
|
#340
Tragic
17.0%
Lumbee
0.0
/100
|
#341
Tragic
17.0%
Immigrants | Yemen
0.0
/100
|
#342
Tragic
17.5%
Pima
0.0
/100
|
#343
Tragic
18.4%
Yup'ik
0.0
/100
|
#344
Tragic
18.7%
Navajo
0.0
/100
|
#345
Tragic
18.8%
Puerto Ricans
0.0
/100
|
#346
Tragic
20.3%
Tohono O'odham
0.0
/100
|
#347
Tragic
20.4%

Demographics Similar to Immigrants from Armenia by Family Poverty

In terms of family poverty, the demographic groups most similar to Immigrants from Armenia are Ottawa (10.0%, a difference of 0.020%), Sudanese (10.0%, a difference of 0.20%), Immigrants from Uzbekistan (10.0%, a difference of 0.21%), Immigrants from Panama (10.0%, a difference of 0.23%), and Immigrants (10.0%, a difference of 0.29%).
DemographicsRating | RankFamily Poverty
Bermudans
5.3
/100
|
#220
Tragic
9.9%
Immigrants | Cambodia
4.8
/100
|
#221
Tragic
9.9%
Japanese
4.8
/100
|
#222
Tragic
9.9%
Immigrants | Africa
4.3
/100
|
#223
Tragic
9.9%
Marshallese
3.9
/100
|
#224
Tragic
9.9%
Immigrants | Immigrants
3.6
/100
|
#225
Tragic
10.0%
Ottawa
3.3
/100
|
#226
Tragic
10.0%
Immigrants | Armenia
3.3
/100
|
#227
Tragic
10.0%
Sudanese
3.1
/100
|
#228
Tragic
10.0%
Immigrants | Uzbekistan
3.1
/100
|
#229
Tragic
10.0%
Immigrants | Panama
3.1
/100
|
#230
Tragic
10.0%
Alaskan Athabascans
2.7
/100
|
#231
Tragic
10.1%
Immigrants | Sudan
2.3
/100
|
#232
Tragic
10.1%
Fijians
2.1
/100
|
#233
Tragic
10.1%
Immigrants | Middle Africa
2.1
/100
|
#234
Tragic
10.1%