Puerto Rican vs Finnish Single Mother Poverty
COMPARE
Puerto Rican
Finnish
Single Mother Poverty
Single Mother Poverty Comparison
Puerto Ricans
Finns
44.5%
SINGLE MOTHER POVERTY
0.0/ 100
METRIC RATING
347th/ 347
METRIC RANK
30.0%
SINGLE MOTHER POVERTY
9.3/ 100
METRIC RATING
219th/ 347
METRIC RANK
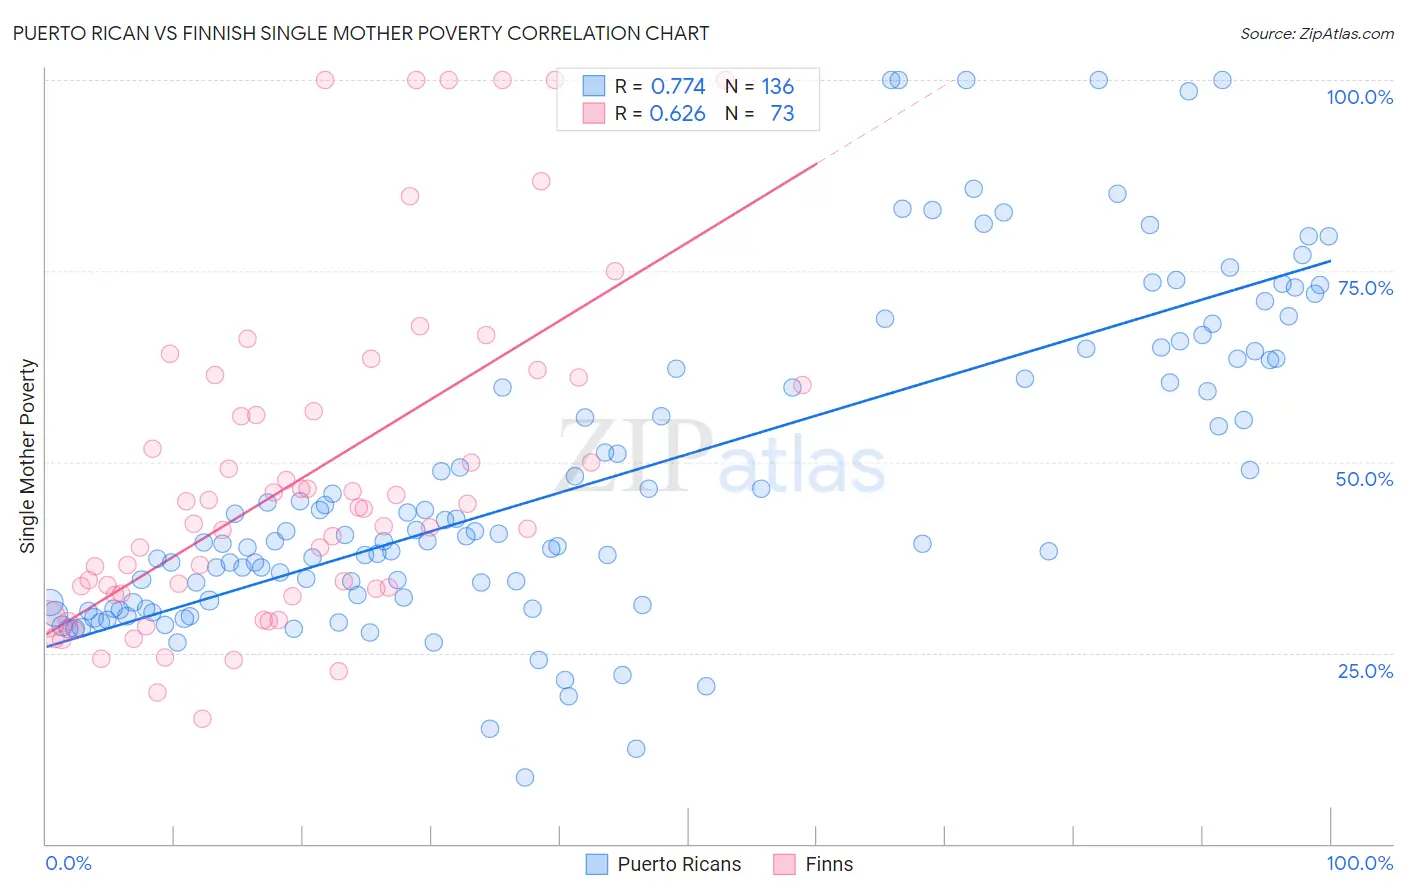
Puerto Rican vs Finnish Single Mother Poverty Correlation Chart
The statistical analysis conducted on geographies consisting of 509,350,600 people shows a strong positive correlation between the proportion of Puerto Ricans and poverty level among single mothers in the United States with a correlation coefficient (R) of 0.774 and weighted average of 44.5%. Similarly, the statistical analysis conducted on geographies consisting of 392,432,308 people shows a significant positive correlation between the proportion of Finns and poverty level among single mothers in the United States with a correlation coefficient (R) of 0.626 and weighted average of 30.0%, a difference of 48.7%.
Single Mother Poverty Correlation Summary
| Measurement | Puerto Rican | Finnish |
| Minimum | 8.7% | 16.4% |
| Maximum | 100.0% | 100.0% |
| Range | 91.3% | 83.6% |
| Mean | 47.8% | 47.6% |
| Median | 40.4% | 42.0% |
| Interquartile 25% (IQ1) | 31.7% | 32.7% |
| Interquartile 75% (IQ3) | 63.4% | 58.3% |
| Interquartile Range (IQR) | 31.7% | 25.6% |
| Standard Deviation (Sample) | 20.8% | 21.5% |
| Standard Deviation (Population) | 20.8% | 21.4% |
Similar Demographics by Single Mother Poverty
Demographics Similar to Puerto Ricans by Single Mother Poverty
In terms of single mother poverty, the demographic groups most similar to Puerto Ricans are Houma (43.5%, a difference of 2.4%), Lumbee (43.2%, a difference of 3.0%), Tohono O'odham (43.0%, a difference of 3.5%), Cajun (40.3%, a difference of 10.4%), and Navajo (40.2%, a difference of 10.8%).
| Demographics | Rating | Rank | Single Mother Poverty |
| Menominee | 0.0 /100 | #333 | Tragic 37.1% |
| Pueblo | 0.0 /100 | #334 | Tragic 37.2% |
| Yuman | 0.0 /100 | #335 | Tragic 37.8% |
| Cheyenne | 0.0 /100 | #336 | Tragic 38.5% |
| Immigrants | Yemen | 0.0 /100 | #337 | Tragic 38.5% |
| Pima | 0.0 /100 | #338 | Tragic 38.6% |
| Crow | 0.0 /100 | #339 | Tragic 38.6% |
| Sioux | 0.0 /100 | #340 | Tragic 38.8% |
| Colville | 0.0 /100 | #341 | Tragic 39.3% |
| Navajo | 0.0 /100 | #342 | Tragic 40.2% |
| Cajuns | 0.0 /100 | #343 | Tragic 40.3% |
| Tohono O'odham | 0.0 /100 | #344 | Tragic 43.0% |
| Lumbee | 0.0 /100 | #345 | Tragic 43.2% |
| Houma | 0.0 /100 | #346 | Tragic 43.5% |
| Puerto Ricans | 0.0 /100 | #347 | Tragic 44.5% |
Demographics Similar to Finns by Single Mother Poverty
In terms of single mother poverty, the demographic groups most similar to Finns are German (30.0%, a difference of 0.070%), Hungarian (29.9%, a difference of 0.14%), Immigrants from Ghana (29.9%, a difference of 0.25%), Immigrants from Eritrea (30.0%, a difference of 0.25%), and Sudanese (30.0%, a difference of 0.25%).
| Demographics | Rating | Rank | Single Mother Poverty |
| Nicaraguans | 12.4 /100 | #212 | Poor 29.8% |
| Immigrants | Thailand | 12.0 /100 | #213 | Poor 29.9% |
| Liberians | 11.7 /100 | #214 | Poor 29.9% |
| Jamaicans | 11.7 /100 | #215 | Poor 29.9% |
| Immigrants | Western Africa | 11.5 /100 | #216 | Poor 29.9% |
| Immigrants | Ghana | 11.3 /100 | #217 | Poor 29.9% |
| Hungarians | 10.3 /100 | #218 | Poor 29.9% |
| Finns | 9.3 /100 | #219 | Tragic 30.0% |
| Germans | 8.8 /100 | #220 | Tragic 30.0% |
| Immigrants | Eritrea | 7.7 /100 | #221 | Tragic 30.0% |
| Sudanese | 7.6 /100 | #222 | Tragic 30.0% |
| Immigrants | Cuba | 6.9 /100 | #223 | Tragic 30.1% |
| Immigrants | Sudan | 6.5 /100 | #224 | Tragic 30.1% |
| Spanish | 6.3 /100 | #225 | Tragic 30.1% |
| Scottish | 6.0 /100 | #226 | Tragic 30.1% |