Pueblo vs Norwegian Child Poverty Under the Age of 16

COMPARE

Pueblo
Race
Ancestry
AfghanAfricanAlaska NativeAlaskan AthabascanAlbanianAleutAlsatianAmericanApacheArabArapahoArgentineanArmenianAssyrian/Chaldean/SyriacAustralianAustrianBahamianBangladeshiBarbadianBasqueBelgianBelizeanBermudanBhutaneseBlackfeetBolivianBrazilianBritishBritish West IndianBulgarianBurmeseCajunCambodianCanadianCape VerdeanCarpatho RusynCelticCentral AmericanCentral American IndianCherokeeCheyenneChickasawChileanChineseChippewaChoctawColombianColvilleComancheCosta RicanCreeCreekCroatianCrowCubanCypriotCzechCzechoslovakianDanishDelawareDominicanDutchDutch West IndianEastern EuropeanEcuadorianEgyptianEnglishEstonianEthiopianEuropeanFijianFilipinoFinnishFrenchFrench American IndianFrench CanadianGermanGerman RussianGhanaianGreekGuamanian/ChamorroGuatemalanGuyaneseHaitianHmongHonduranHopiHoumaHungarianIcelanderIndian (Asian)IndonesianInupiatIranianIraqiIrishIroquoisIsraeliItalianJamaicanJapaneseJordanianKenyanKiowaKoreanLaotianLatvianLebaneseLiberianLithuanianLumbeeLuxembourgerMacedonianMalaysianMalteseMarshalleseMenomineeMexicanMexican American IndianMongolianMoroccanNative HawaiianNavajoNepaleseNew ZealanderNicaraguanNigerianNorthern EuropeanOkinawanOsageOttawaPaiutePakistaniPalestinianPanamanianParaguayanPennsylvania GermanPeruvianPimaPolishPortuguesePotawatomiPuebloPuerto RicanPuget Sound SalishRomanianRussianSalvadoranSamoanScandinavianScotch-IrishScottishSeminoleSenegaleseSerbianShoshoneSierra LeoneanSiouxSlavicSlovakSloveneSomaliSouth AfricanSouth AmericanSouth American IndianSoviet UnionSpaniardSpanishSpanish AmericanSpanish American IndianSri LankanSubsaharan AfricanSudaneseSwedishSwissSyrianTaiwaneseThaiTlingit-HaidaTohono O'OdhamTonganTrinidadian and TobagonianTsimshianTurkishU.S. Virgin IslanderUgandanUkrainianUruguayanUteVenezuelanVietnameseWelshWest IndianYakamaYaquiYugoslavianYumanYup'ikZimbabwean
Immigration
NonimmigrantsImmigrantsAfghanistanAfricaAlbaniaArgentinaArmeniaAsiaAustraliaAustriaBahamasBangladeshBarbadosBelarusBelgiumBelizeBoliviaBosnia and HerzegovinaBrazilBulgariaBurma/MyanmarCabo VerdeCambodiaCameroonCanadaCaribbeanCentral AmericaChileChinaColombiaCongoCosta RicaCroatiaCubaCzechoslovakiaDenmarkDominicaDominican RepublicEastern AfricaEastern AsiaEastern EuropeEcuadorEgyptEl SalvadorEnglandEritreaEthiopiaEuropeFijiFranceGermanyGhanaGreeceGrenadaGuatemalaGuyanaHaitiHondurasHong KongHungaryIndiaIndonesiaIranIraqIrelandIsraelItalyJamaicaJapanJordanKazakhstanKenyaKoreaKuwaitLaosLatin AmericaLatviaLebanonLiberiaLithuaniaMalaysiaMexicoMicronesiaMiddle AfricaMoldovaMoroccoNepalNetherlandsNicaraguaNigeriaNorth AmericaNorth MacedoniaNorthern AfricaNorthern EuropeNorwayOceaniaPakistanPanamaPeruPhilippinesPolandPortugalRomaniaRussiaSaudi ArabiaScotlandSenegalSerbiaSierra LeoneSingaporeSomaliaSouth AfricaSouth AmericaSouth Central AsiaSouth Eastern AsiaSouthern EuropeSpainSri LankaSt. Vincent and the GrenadinesSudanSwedenSwitzerlandSyriaTaiwanThailandTrinidad and TobagoTurkeyUgandaUkraineUruguayUzbekistanVenezuelaVietnamWest IndiesWestern AfricaWestern AsiaWestern EuropeYemenZaireZimbabweAzores
Norwegian
Race
Ancestry
AfghanAfricanAlaska NativeAlaskan AthabascanAlbanianAleutAlsatianAmericanApacheArabArapahoArgentineanArmenianAssyrian/Chaldean/SyriacAustralianAustrianBahamianBangladeshiBarbadianBasqueBelgianBelizeanBermudanBhutaneseBlackfeetBolivianBrazilianBritishBritish West IndianBulgarianBurmeseCajunCambodianCanadianCape VerdeanCarpatho RusynCelticCentral AmericanCentral American IndianCherokeeCheyenneChickasawChileanChineseChippewaChoctawColombianColvilleComancheCosta RicanCreeCreekCroatianCrowCubanCypriotCzechCzechoslovakianDanishDelawareDominicanDutchDutch West IndianEastern EuropeanEcuadorianEgyptianEnglishEstonianEthiopianEuropeanFijianFilipinoFinnishFrenchFrench American IndianFrench CanadianGermanGerman RussianGhanaianGreekGuamanian/ChamorroGuatemalanGuyaneseHaitianHmongHonduranHopiHoumaHungarianIcelanderIndian (Asian)IndonesianInupiatIranianIraqiIrishIroquoisIsraeliItalianJamaicanJapaneseJordanianKenyanKiowaKoreanLaotianLatvianLebaneseLiberianLithuanianLumbeeLuxembourgerMacedonianMalaysianMalteseMarshalleseMenomineeMexicanMexican American IndianMongolianMoroccanNative HawaiianNavajoNepaleseNew ZealanderNicaraguanNigerianNorthern EuropeanNorwegianOkinawanOsageOttawaPaiutePakistaniPalestinianPanamanianParaguayanPennsylvania GermanPeruvianPimaPolishPortuguesePotawatomiPuerto RicanPuget Sound SalishRomanianRussianSalvadoranSamoanScandinavianScotch-IrishScottishSeminoleSenegaleseSerbianShoshoneSierra LeoneanSiouxSlavicSlovakSloveneSomaliSouth AfricanSouth AmericanSouth American IndianSoviet UnionSpaniardSpanishSpanish AmericanSpanish American IndianSri LankanSubsaharan AfricanSudaneseSwedishSwissSyrianTaiwaneseThaiTlingit-HaidaTohono O'OdhamTonganTrinidadian and TobagonianTsimshianTurkishU.S. Virgin IslanderUgandanUkrainianUruguayanUteVenezuelanVietnameseWelshWest IndianYakamaYaquiYugoslavianYumanYup'ikZimbabwean
Immigration
NonimmigrantsImmigrantsAfghanistanAfricaAlbaniaArgentinaArmeniaAsiaAustraliaAustriaBahamasBangladeshBarbadosBelarusBelgiumBelizeBoliviaBosnia and HerzegovinaBrazilBulgariaBurma/MyanmarCabo VerdeCambodiaCameroonCanadaCaribbeanCentral AmericaChileChinaColombiaCongoCosta RicaCroatiaCubaCzechoslovakiaDenmarkDominicaDominican RepublicEastern AfricaEastern AsiaEastern EuropeEcuadorEgyptEl SalvadorEnglandEritreaEthiopiaEuropeFijiFranceGermanyGhanaGreeceGrenadaGuatemalaGuyanaHaitiHondurasHong KongHungaryIndiaIndonesiaIranIraqIrelandIsraelItalyJamaicaJapanJordanKazakhstanKenyaKoreaKuwaitLaosLatin AmericaLatviaLebanonLiberiaLithuaniaMalaysiaMexicoMicronesiaMiddle AfricaMoldovaMoroccoNepalNetherlandsNicaraguaNigeriaNorth AmericaNorth MacedoniaNorthern AfricaNorthern EuropeNorwayOceaniaPakistanPanamaPeruPhilippinesPolandPortugalRomaniaRussiaSaudi ArabiaScotlandSenegalSerbiaSierra LeoneSingaporeSomaliaSouth AfricaSouth AmericaSouth Central AsiaSouth Eastern AsiaSouthern EuropeSpainSri LankaSt. Vincent and the GrenadinesSudanSwedenSwitzerlandSyriaTaiwanThailandTrinidad and TobagoTurkeyUgandaUkraineUruguayUzbekistanVenezuelaVietnamWest IndiesWestern AfricaWestern AsiaWestern EuropeYemenZaireZimbabweAzores
Child Poverty Under the Age of 16
Income
Poverty
Unemployment
Labor Participation
Family Structure
Vehicle Availability
Education Level
Disability

Child Poverty Under the Age of 16 Comparison

Pueblo

Norwegians

Tragic
Exceptional
23.9%
CHILD POVERTY UNDER THE AGE OF 16
0.0/ 100
METRIC RATING
332nd/ 347
METRIC RANK
13.0%
CHILD POVERTY UNDER THE AGE OF 16
99.9/ 100
METRIC RATING
16th/ 347
METRIC RANK

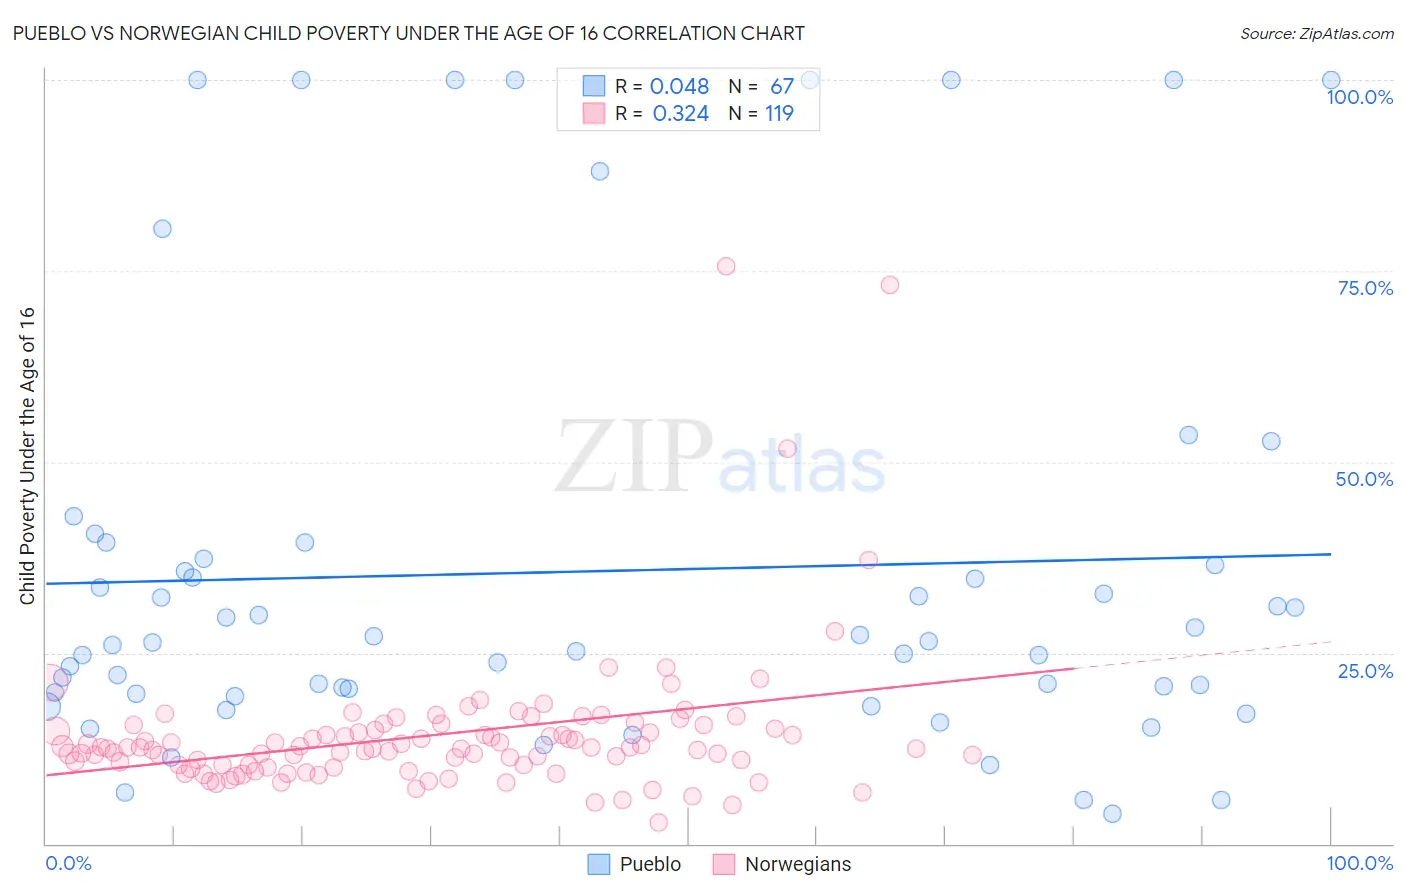
Pueblo vs Norwegian Child Poverty Under the Age of 16 Correlation Chart

The statistical analysis conducted on geographies consisting of 119,831,581 people shows no correlation between the proportion of Pueblo and poverty level among children under the age of 16 in the United States with a correlation coefficient (R) of 0.048 and weighted average of 23.9%. Similarly, the statistical analysis conducted on geographies consisting of 523,024,216 people shows a mild positive correlation between the proportion of Norwegians and poverty level among children under the age of 16 in the United States with a correlation coefficient (R) of 0.324 and weighted average of 13.0%, a difference of 84.7%.
Pueblo vs Norwegian Child Poverty Under the Age of 16

Child Poverty Under the Age of 16 Correlation Summary

MeasurementPuebloNorwegian
Minimum4.0%2.9%
Maximum100.0%75.6%
Range96.0%72.8%
Mean35.7%14.2%
Median26.3%12.5%
Interquartile 25% (IQ1)19.7%10.3%
Interquartile 75% (IQ3)37.3%15.1%
Interquartile Range (IQR)17.6%4.9%
Standard Deviation (Sample)27.8%9.8%
Standard Deviation (Population)27.5%9.7%

Similar Demographics by Child Poverty Under the Age of 16

Demographics Similar to Pueblo by Child Poverty Under the Age of 16

In terms of child poverty under the age of 16, the demographic groups most similar to Pueblo are Immigrants from Dominican Republic (24.0%, a difference of 0.17%), Apache (23.8%, a difference of 0.38%), Native/Alaskan (23.8%, a difference of 0.60%), Dominican (23.8%, a difference of 0.69%), and Black/African American (24.4%, a difference of 2.1%).
DemographicsRating | RankChild Poverty Under the Age of 16
Immigrants | Congo
0.0
/100
|
#325
Tragic
22.5%
Immigrants | Honduras
0.0
/100
|
#326
Tragic
22.7%
Menominee
0.0
/100
|
#327
Tragic
23.0%
Colville
0.0
/100
|
#328
Tragic
23.0%
Dominicans
0.0
/100
|
#329
Tragic
23.8%
Natives/Alaskans
0.0
/100
|
#330
Tragic
23.8%
Apache
0.0
/100
|
#331
Tragic
23.8%
Pueblo
0.0
/100
|
#332
Tragic
23.9%
Immigrants | Dominican Republic
0.0
/100
|
#333
Tragic
24.0%
Blacks/African Americans
0.0
/100
|
#334
Tragic
24.4%
Houma
0.0
/100
|
#335
Tragic
24.9%
Yup'ik
0.0
/100
|
#336
Tragic
25.1%
Sioux
0.0
/100
|
#337
Tragic
25.2%
Cheyenne
0.0
/100
|
#338
Tragic
25.4%
Crow
0.0
/100
|
#339
Tragic
26.0%

Demographics Similar to Norwegians by Child Poverty Under the Age of 16

In terms of child poverty under the age of 16, the demographic groups most similar to Norwegians are Immigrants from Korea (13.0%, a difference of 0.050%), Bulgarian (13.0%, a difference of 0.22%), Immigrants from Lithuania (12.9%, a difference of 0.35%), Cypriot (13.0%, a difference of 0.64%), and Immigrants from Japan (13.0%, a difference of 0.68%).
DemographicsRating | RankChild Poverty Under the Age of 16
Immigrants | Iran
100.0
/100
|
#9
Exceptional
12.4%
Immigrants | South Central Asia
99.9
/100
|
#10
Exceptional
12.5%
Bhutanese
99.9
/100
|
#11
Exceptional
12.5%
Immigrants | Ireland
99.9
/100
|
#12
Exceptional
12.7%
Burmese
99.9
/100
|
#13
Exceptional
12.8%
Immigrants | Lithuania
99.9
/100
|
#14
Exceptional
12.9%
Immigrants | Korea
99.9
/100
|
#15
Exceptional
13.0%
Norwegians
99.9
/100
|
#16
Exceptional
13.0%
Bulgarians
99.9
/100
|
#17
Exceptional
13.0%
Cypriots
99.9
/100
|
#18
Exceptional
13.0%
Immigrants | Japan
99.8
/100
|
#19
Exceptional
13.0%
Okinawans
99.8
/100
|
#20
Exceptional
13.1%
Immigrants | Eastern Asia
99.8
/100
|
#21
Exceptional
13.1%
Maltese
99.8
/100
|
#22
Exceptional
13.1%
Indians (Asian)
99.8
/100
|
#23
Exceptional
13.1%