Pueblo vs Moroccan Single Father Poverty
COMPARE
Pueblo
Moroccan
Single Father Poverty
Single Father Poverty Comparison
Pueblo
Moroccans
21.1%
SINGLE FATHER POVERTY
0.0/ 100
METRIC RATING
328th/ 347
METRIC RANK
17.0%
SINGLE FATHER POVERTY
2.1/ 100
METRIC RATING
242nd/ 347
METRIC RANK
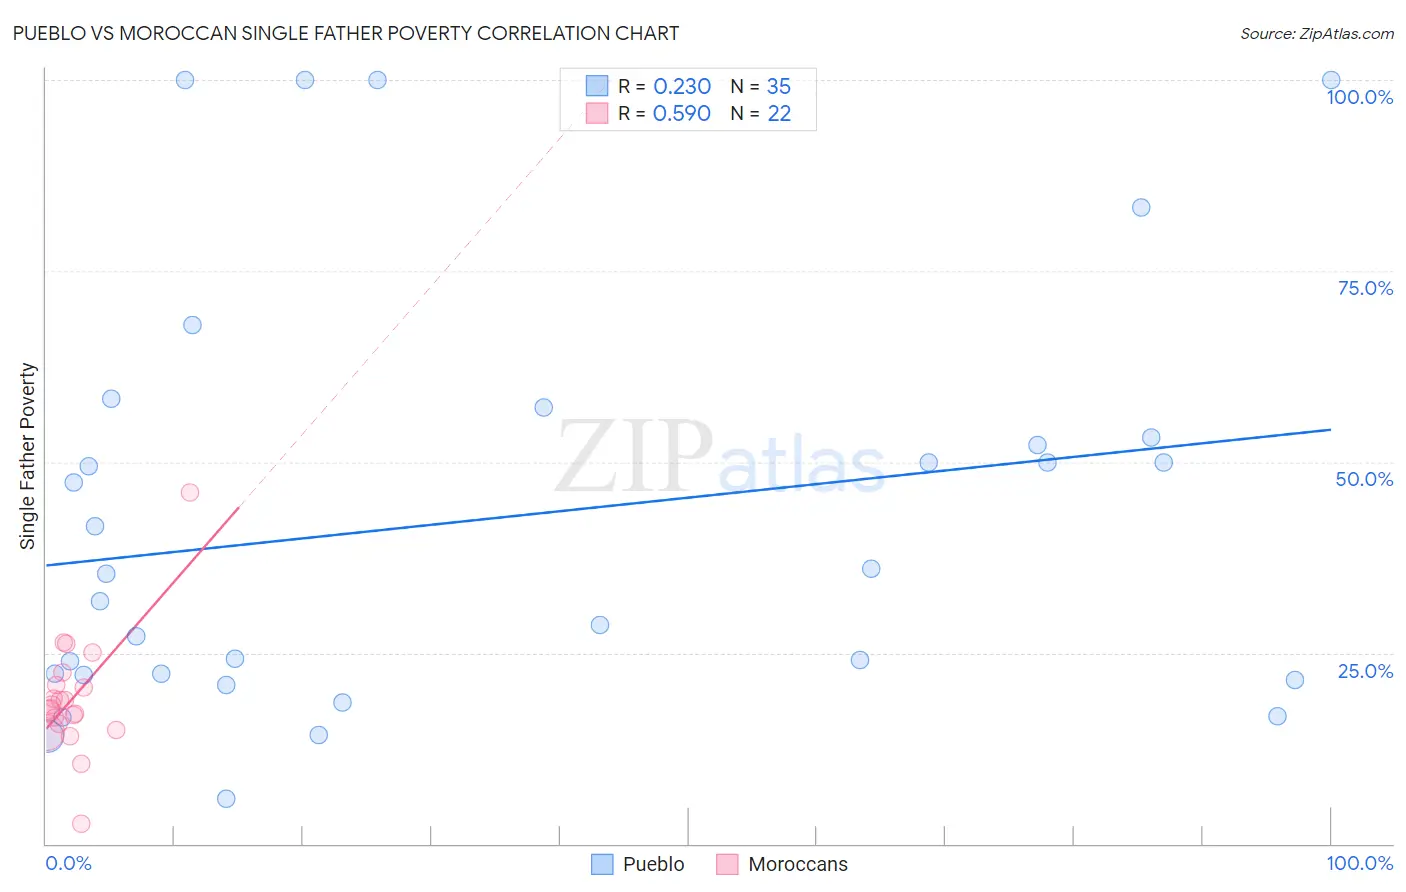
Pueblo vs Moroccan Single Father Poverty Correlation Chart
The statistical analysis conducted on geographies consisting of 109,475,284 people shows a weak positive correlation between the proportion of Pueblo and poverty level among single fathers in the United States with a correlation coefficient (R) of 0.230 and weighted average of 21.1%. Similarly, the statistical analysis conducted on geographies consisting of 173,540,722 people shows a substantial positive correlation between the proportion of Moroccans and poverty level among single fathers in the United States with a correlation coefficient (R) of 0.590 and weighted average of 17.0%, a difference of 24.4%.
Single Father Poverty Correlation Summary
| Measurement | Pueblo | Moroccan |
| Minimum | 5.9% | 2.6% |
| Maximum | 100.0% | 46.0% |
| Range | 94.1% | 43.4% |
| Mean | 42.5% | 19.1% |
| Median | 35.3% | 17.9% |
| Interquartile 25% (IQ1) | 22.1% | 15.7% |
| Interquartile 75% (IQ3) | 53.2% | 20.7% |
| Interquartile Range (IQR) | 31.2% | 5.0% |
| Standard Deviation (Sample) | 27.2% | 7.9% |
| Standard Deviation (Population) | 26.8% | 7.7% |
Similar Demographics by Single Father Poverty
Demographics Similar to Pueblo by Single Father Poverty
In terms of single father poverty, the demographic groups most similar to Pueblo are Colville (21.4%, a difference of 1.1%), Choctaw (20.7%, a difference of 1.9%), Paiute (21.6%, a difference of 2.4%), Immigrants from Yemen (20.6%, a difference of 2.6%), and Central American Indian (21.7%, a difference of 2.6%).
| Demographics | Rating | Rank | Single Father Poverty |
| Cherokee | 0.0 /100 | #321 | Tragic 19.6% |
| Creek | 0.0 /100 | #322 | Tragic 19.8% |
| Pennsylvania Germans | 0.0 /100 | #323 | Tragic 20.0% |
| Americans | 0.0 /100 | #324 | Tragic 20.1% |
| Blacks/African Americans | 0.0 /100 | #325 | Tragic 20.4% |
| Immigrants | Yemen | 0.0 /100 | #326 | Tragic 20.6% |
| Choctaw | 0.0 /100 | #327 | Tragic 20.7% |
| Pueblo | 0.0 /100 | #328 | Tragic 21.1% |
| Colville | 0.0 /100 | #329 | Tragic 21.4% |
| Paiute | 0.0 /100 | #330 | Tragic 21.6% |
| Central American Indians | 0.0 /100 | #331 | Tragic 21.7% |
| Tohono O'odham | 0.0 /100 | #332 | Tragic 22.0% |
| Natives/Alaskans | 0.0 /100 | #333 | Tragic 22.4% |
| Kiowa | 0.0 /100 | #334 | Tragic 22.5% |
| Shoshone | 0.0 /100 | #335 | Tragic 22.9% |
Demographics Similar to Moroccans by Single Father Poverty
In terms of single father poverty, the demographic groups most similar to Moroccans are Czech (17.0%, a difference of 0.10%), Finnish (16.9%, a difference of 0.22%), Bermudan (16.9%, a difference of 0.23%), Immigrants from Saudi Arabia (16.9%, a difference of 0.25%), and Subsaharan African (16.9%, a difference of 0.32%).
| Demographics | Rating | Rank | Single Father Poverty |
| Immigrants | Western Europe | 2.9 /100 | #235 | Tragic 16.9% |
| Immigrants | Germany | 2.9 /100 | #236 | Tragic 16.9% |
| Sub-Saharan Africans | 2.9 /100 | #237 | Tragic 16.9% |
| Immigrants | Saudi Arabia | 2.7 /100 | #238 | Tragic 16.9% |
| Bermudans | 2.6 /100 | #239 | Tragic 16.9% |
| Finns | 2.6 /100 | #240 | Tragic 16.9% |
| Czechs | 2.3 /100 | #241 | Tragic 17.0% |
| Moroccans | 2.1 /100 | #242 | Tragic 17.0% |
| Immigrants | Cabo Verde | 1.6 /100 | #243 | Tragic 17.0% |
| Hondurans | 1.6 /100 | #244 | Tragic 17.0% |
| Trinidadians and Tobagonians | 1.5 /100 | #245 | Tragic 17.0% |
| Immigrants | Ireland | 1.4 /100 | #246 | Tragic 17.1% |
| Greeks | 1.3 /100 | #247 | Tragic 17.1% |
| Czechoslovakians | 1.3 /100 | #248 | Tragic 17.1% |
| Canadians | 1.3 /100 | #249 | Tragic 17.1% |