Potawatomi vs Immigrants from Bolivia Family Poverty

COMPARE

Potawatomi
Race
Ancestry
AfghanAfricanAlaska NativeAlaskan AthabascanAlbanianAleutAlsatianAmericanApacheArabArapahoArgentineanArmenianAssyrian/Chaldean/SyriacAustralianAustrianBahamianBangladeshiBarbadianBasqueBelgianBelizeanBermudanBhutaneseBlackfeetBolivianBrazilianBritishBritish West IndianBulgarianBurmeseCajunCambodianCanadianCape VerdeanCarpatho RusynCelticCentral AmericanCentral American IndianCherokeeCheyenneChickasawChileanChineseChippewaChoctawColombianColvilleComancheCosta RicanCreeCreekCroatianCrowCubanCypriotCzechCzechoslovakianDanishDelawareDominicanDutchDutch West IndianEastern EuropeanEcuadorianEgyptianEnglishEstonianEthiopianEuropeanFijianFilipinoFinnishFrenchFrench American IndianFrench CanadianGermanGerman RussianGhanaianGreekGuamanian/ChamorroGuatemalanGuyaneseHaitianHmongHonduranHopiHoumaHungarianIcelanderIndian (Asian)IndonesianInupiatIranianIraqiIrishIroquoisIsraeliItalianJamaicanJapaneseJordanianKenyanKiowaKoreanLaotianLatvianLebaneseLiberianLithuanianLumbeeLuxembourgerMacedonianMalaysianMalteseMarshalleseMenomineeMexicanMexican American IndianMongolianMoroccanNative HawaiianNavajoNepaleseNew ZealanderNicaraguanNigerianNorthern EuropeanNorwegianOkinawanOsageOttawaPaiutePakistaniPalestinianPanamanianParaguayanPennsylvania GermanPeruvianPimaPolishPortuguesePotawatomiPuebloPuerto RicanPuget Sound SalishRomanianRussianSalvadoranSamoanScandinavianScotch-IrishScottishSeminoleSenegaleseSerbianShoshoneSierra LeoneanSiouxSlavicSlovakSloveneSomaliSouth AfricanSouth AmericanSouth American IndianSoviet UnionSpaniardSpanishSpanish AmericanSpanish American IndianSri LankanSubsaharan AfricanSudaneseSwedishSwissSyrianTaiwaneseThaiTlingit-HaidaTohono O'OdhamTonganTrinidadian and TobagonianTsimshianTurkishU.S. Virgin IslanderUgandanUkrainianUruguayanUteVenezuelanVietnameseWelshWest IndianYakamaYaquiYugoslavianYumanYup'ikZimbabwean
Immigration
NonimmigrantsImmigrantsAfghanistanAfricaAlbaniaArgentinaArmeniaAsiaAustraliaAustriaBahamasBangladeshBarbadosBelarusBelgiumBelizeBosnia and HerzegovinaBrazilBulgariaBurma/MyanmarCabo VerdeCambodiaCameroonCanadaCaribbeanCentral AmericaChileChinaColombiaCongoCosta RicaCroatiaCubaCzechoslovakiaDenmarkDominicaDominican RepublicEastern AfricaEastern AsiaEastern EuropeEcuadorEgyptEl SalvadorEnglandEritreaEthiopiaEuropeFijiFranceGermanyGhanaGreeceGrenadaGuatemalaGuyanaHaitiHondurasHong KongHungaryIndiaIndonesiaIranIraqIrelandIsraelItalyJamaicaJapanJordanKazakhstanKenyaKoreaKuwaitLaosLatin AmericaLatviaLebanonLiberiaLithuaniaMalaysiaMexicoMicronesiaMiddle AfricaMoldovaMoroccoNepalNetherlandsNicaraguaNigeriaNorth AmericaNorth MacedoniaNorthern AfricaNorthern EuropeNorwayOceaniaPakistanPanamaPeruPhilippinesPolandPortugalRomaniaRussiaSaudi ArabiaScotlandSenegalSerbiaSierra LeoneSingaporeSomaliaSouth AfricaSouth AmericaSouth Central AsiaSouth Eastern AsiaSouthern EuropeSpainSri LankaSt. Vincent and the GrenadinesSudanSwedenSwitzerlandSyriaTaiwanThailandTrinidad and TobagoTurkeyUgandaUkraineUruguayUzbekistanVenezuelaVietnamWest IndiesWestern AfricaWestern AsiaWestern EuropeYemenZaireZimbabweAzores
Immigrants from Bolivia
Race
Ancestry
AfghanAfricanAlaska NativeAlaskan AthabascanAlbanianAleutAlsatianAmericanApacheArabArapahoArgentineanArmenianAssyrian/Chaldean/SyriacAustralianAustrianBahamianBangladeshiBarbadianBasqueBelgianBelizeanBermudanBhutaneseBlackfeetBolivianBrazilianBritishBritish West IndianBulgarianBurmeseCajunCambodianCanadianCape VerdeanCarpatho RusynCelticCentral AmericanCentral American IndianCherokeeCheyenneChickasawChileanChineseChippewaChoctawColombianColvilleComancheCosta RicanCreeCreekCroatianCrowCubanCypriotCzechCzechoslovakianDanishDelawareDominicanDutchDutch West IndianEastern EuropeanEcuadorianEgyptianEnglishEstonianEthiopianEuropeanFijianFilipinoFinnishFrenchFrench American IndianFrench CanadianGermanGerman RussianGhanaianGreekGuamanian/ChamorroGuatemalanGuyaneseHaitianHmongHonduranHopiHoumaHungarianIcelanderIndian (Asian)IndonesianInupiatIranianIraqiIrishIroquoisIsraeliItalianJamaicanJapaneseJordanianKenyanKiowaKoreanLaotianLatvianLebaneseLiberianLithuanianLumbeeLuxembourgerMacedonianMalaysianMalteseMarshalleseMenomineeMexicanMexican American IndianMongolianMoroccanNative HawaiianNavajoNepaleseNew ZealanderNicaraguanNigerianNorthern EuropeanNorwegianOkinawanOsageOttawaPaiutePakistaniPalestinianPanamanianParaguayanPennsylvania GermanPeruvianPimaPolishPortuguesePuebloPuerto RicanPuget Sound SalishRomanianRussianSalvadoranSamoanScandinavianScotch-IrishScottishSeminoleSenegaleseSerbianShoshoneSierra LeoneanSiouxSlavicSlovakSloveneSomaliSouth AfricanSouth AmericanSouth American IndianSoviet UnionSpaniardSpanishSpanish AmericanSpanish American IndianSri LankanSubsaharan AfricanSudaneseSwedishSwissSyrianTaiwaneseThaiTlingit-HaidaTohono O'OdhamTonganTrinidadian and TobagonianTsimshianTurkishU.S. Virgin IslanderUgandanUkrainianUruguayanUteVenezuelanVietnameseWelshWest IndianYakamaYaquiYugoslavianYumanYup'ikZimbabwean
Immigration
NonimmigrantsImmigrantsAfghanistanAfricaAlbaniaArgentinaArmeniaAsiaAustraliaAustriaBahamasBangladeshBarbadosBelarusBelgiumBelizeBoliviaBosnia and HerzegovinaBrazilBulgariaBurma/MyanmarCabo VerdeCambodiaCameroonCanadaCaribbeanCentral AmericaChileChinaColombiaCongoCosta RicaCroatiaCubaCzechoslovakiaDenmarkDominicaDominican RepublicEastern AfricaEastern AsiaEastern EuropeEcuadorEgyptEl SalvadorEnglandEritreaEthiopiaEuropeFijiFranceGermanyGhanaGreeceGrenadaGuatemalaGuyanaHaitiHondurasHong KongHungaryIndiaIndonesiaIranIraqIrelandIsraelItalyJamaicaJapanJordanKazakhstanKenyaKoreaKuwaitLaosLatin AmericaLatviaLebanonLiberiaLithuaniaMalaysiaMexicoMicronesiaMiddle AfricaMoldovaMoroccoNepalNetherlandsNicaraguaNigeriaNorth AmericaNorth MacedoniaNorthern AfricaNorthern EuropeNorwayOceaniaPakistanPanamaPeruPhilippinesPolandPortugalRomaniaRussiaSaudi ArabiaScotlandSenegalSerbiaSierra LeoneSingaporeSomaliaSouth AfricaSouth AmericaSouth Central AsiaSouth Eastern AsiaSouthern EuropeSpainSri LankaSt. Vincent and the GrenadinesSudanSwedenSwitzerlandSyriaTaiwanThailandTrinidad and TobagoTurkeyUgandaUkraineUruguayUzbekistanVenezuelaVietnamWest IndiesWestern AfricaWestern AsiaWestern EuropeYemenZaireZimbabweAzores
Family Poverty
Income
Poverty
Unemployment
Labor Participation
Family Structure
Vehicle Availability
Education Level
Disability

Family Poverty Comparison

Potawatomi

Immigrants from Bolivia

Tragic
Exceptional
10.2%
FAMILY POVERTY
1.5/ 100
METRIC RATING
239th/ 347
METRIC RANK
7.7%
FAMILY POVERTY
98.9/ 100
METRIC RATING
49th/ 347
METRIC RANK

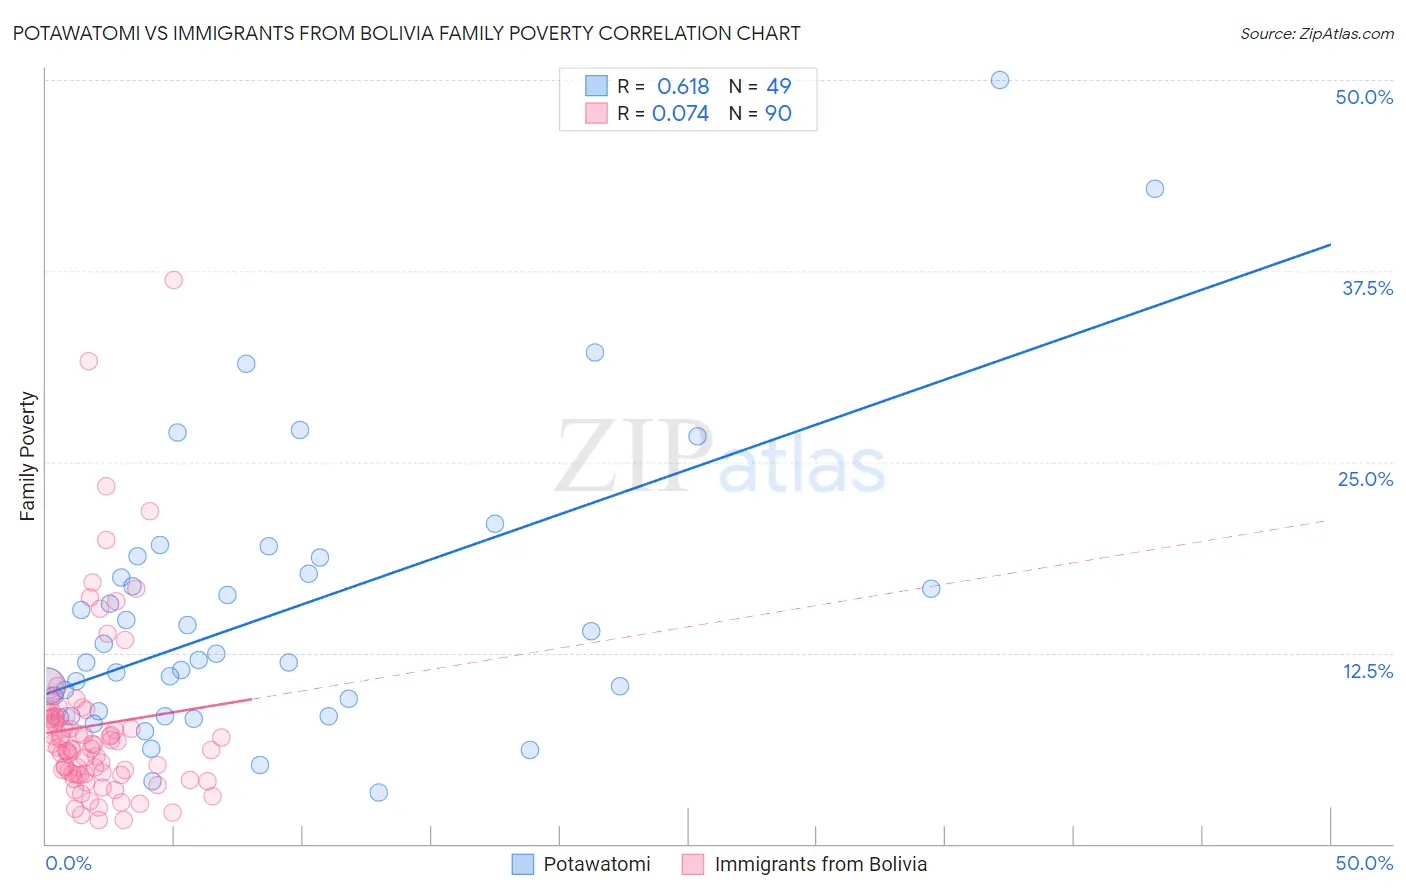
Potawatomi vs Immigrants from Bolivia Family Poverty Correlation Chart

The statistical analysis conducted on geographies consisting of 117,705,487 people shows a significant positive correlation between the proportion of Potawatomi and poverty level among families in the United States with a correlation coefficient (R) of 0.618 and weighted average of 10.2%. Similarly, the statistical analysis conducted on geographies consisting of 158,596,723 people shows a slight positive correlation between the proportion of Immigrants from Bolivia and poverty level among families in the United States with a correlation coefficient (R) of 0.074 and weighted average of 7.7%, a difference of 33.3%.
Potawatomi vs Immigrants from Bolivia Family Poverty

Family Poverty Correlation Summary

MeasurementPotawatomiImmigrants from Bolivia
Minimum3.4%1.5%
Maximum50.0%36.9%
Range46.6%35.4%
Mean15.1%7.8%
Median12.0%6.4%
Interquartile 25% (IQ1)8.5%4.6%
Interquartile 75% (IQ3)18.2%8.4%
Interquartile Range (IQR)9.7%3.8%
Standard Deviation (Sample)9.4%5.9%
Standard Deviation (Population)9.3%5.9%

Similar Demographics by Family Poverty

Demographics Similar to Potawatomi by Family Poverty

In terms of family poverty, the demographic groups most similar to Potawatomi are French American Indian (10.2%, a difference of 0.040%), Immigrants from the Azores (10.3%, a difference of 0.31%), Ghanaian (10.3%, a difference of 0.39%), Immigrants from Laos (10.2%, a difference of 0.40%), and Immigrants from Nigeria (10.2%, a difference of 0.67%).
DemographicsRating | RankFamily Poverty
Immigrants | Sudan
2.3
/100
|
#232
Tragic
10.1%
Fijians
2.1
/100
|
#233
Tragic
10.1%
Immigrants | Middle Africa
2.1
/100
|
#234
Tragic
10.1%
Nigerians
2.0
/100
|
#235
Tragic
10.1%
Immigrants | Nigeria
1.9
/100
|
#236
Tragic
10.2%
Immigrants | Laos
1.7
/100
|
#237
Tragic
10.2%
French American Indians
1.5
/100
|
#238
Tragic
10.2%
Potawatomi
1.5
/100
|
#239
Tragic
10.2%
Immigrants | Azores
1.4
/100
|
#240
Tragic
10.3%
Ghanaians
1.3
/100
|
#241
Tragic
10.3%
Alaska Natives
1.0
/100
|
#242
Tragic
10.4%
Nepalese
0.8
/100
|
#243
Tragic
10.4%
Cree
0.7
/100
|
#244
Tragic
10.5%
Immigrants | Burma/Myanmar
0.6
/100
|
#245
Tragic
10.5%
Cherokee
0.5
/100
|
#246
Tragic
10.6%

Demographics Similar to Immigrants from Bolivia by Family Poverty

In terms of family poverty, the demographic groups most similar to Immigrants from Bolivia are Immigrants from North Macedonia (7.7%, a difference of 0.030%), Immigrants from Moldova (7.7%, a difference of 0.18%), Immigrants from Sri Lanka (7.7%, a difference of 0.19%), Immigrants from Czechoslovakia (7.7%, a difference of 0.20%), and Tongan (7.7%, a difference of 0.22%).
DemographicsRating | RankFamily Poverty
Scandinavians
99.1
/100
|
#42
Exceptional
7.6%
Immigrants | Austria
99.1
/100
|
#43
Exceptional
7.6%
Germans
99.0
/100
|
#44
Exceptional
7.7%
Okinawans
98.9
/100
|
#45
Exceptional
7.7%
Tongans
98.9
/100
|
#46
Exceptional
7.7%
Immigrants | Czechoslovakia
98.9
/100
|
#47
Exceptional
7.7%
Immigrants | Sri Lanka
98.9
/100
|
#48
Exceptional
7.7%
Immigrants | Bolivia
98.9
/100
|
#49
Exceptional
7.7%
Immigrants | North Macedonia
98.9
/100
|
#50
Exceptional
7.7%
Immigrants | Moldova
98.8
/100
|
#51
Exceptional
7.7%
Indians (Asian)
98.8
/100
|
#52
Exceptional
7.7%
Swiss
98.8
/100
|
#53
Exceptional
7.7%
Immigrants | Sweden
98.8
/100
|
#54
Exceptional
7.7%
Immigrants | Eastern Asia
98.7
/100
|
#55
Exceptional
7.7%
Immigrants | Serbia
98.7
/100
|
#56
Exceptional
7.7%