Portuguese vs Immigrants from Somalia Seniors Poverty Over the Age of 65
COMPARE
Portuguese
Immigrants from Somalia
Seniors Poverty Over the Age of 65
Seniors Poverty Over the Age of 65 Comparison
Portuguese
Immigrants from Somalia
10.5%
SENIORS POVERTY OVER THE AGE OF 65
84.1/ 100
METRIC RATING
139th/ 347
METRIC RANK
12.6%
SENIORS POVERTY OVER THE AGE OF 65
0.1/ 100
METRIC RATING
268th/ 347
METRIC RANK
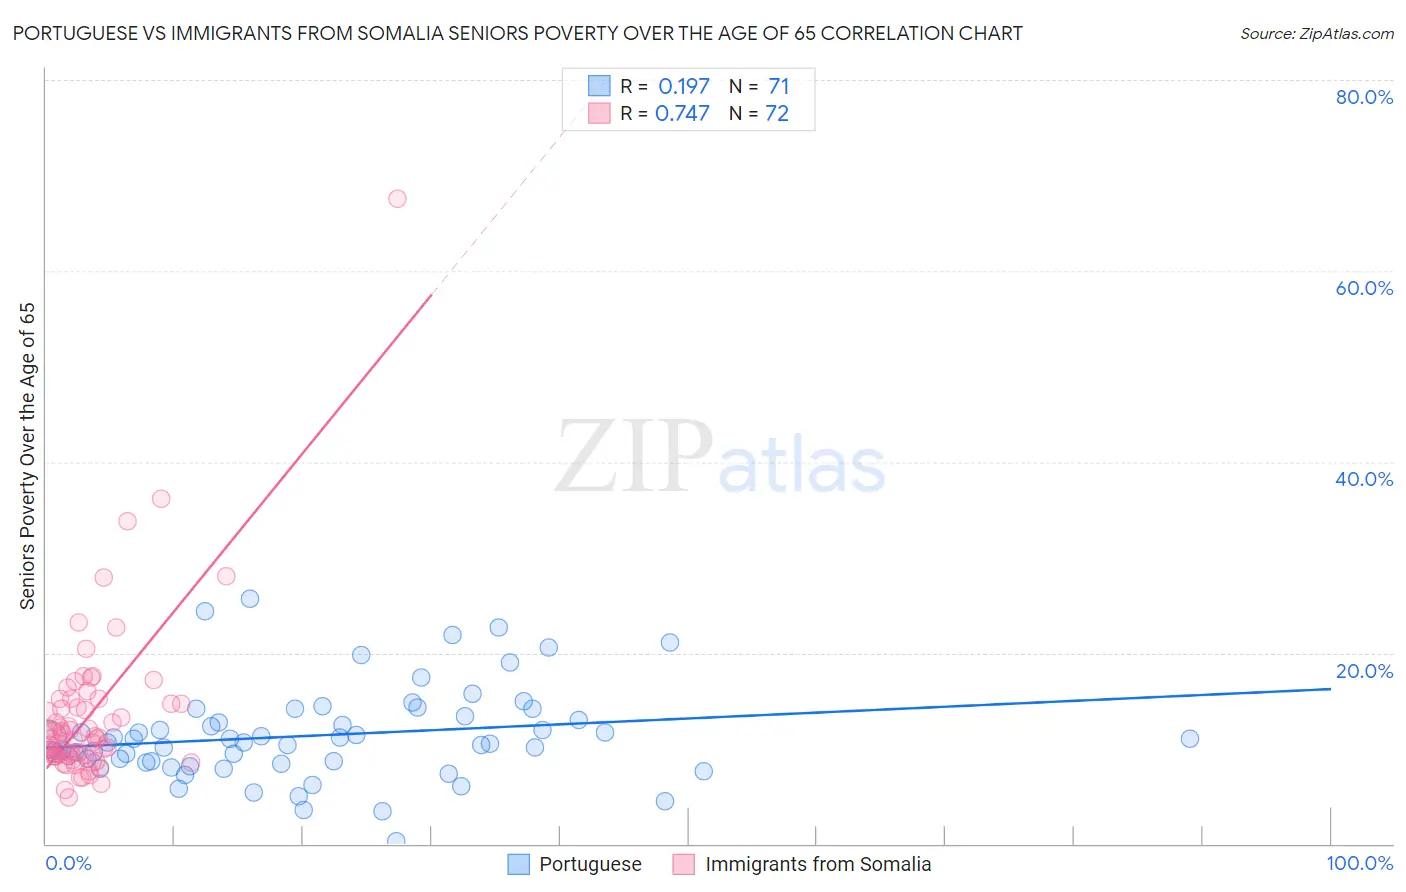
Portuguese vs Immigrants from Somalia Seniors Poverty Over the Age of 65 Correlation Chart
The statistical analysis conducted on geographies consisting of 447,984,891 people shows a poor positive correlation between the proportion of Portuguese and poverty level among seniors over the age of 65 in the United States with a correlation coefficient (R) of 0.197 and weighted average of 10.5%. Similarly, the statistical analysis conducted on geographies consisting of 92,073,309 people shows a strong positive correlation between the proportion of Immigrants from Somalia and poverty level among seniors over the age of 65 in the United States with a correlation coefficient (R) of 0.747 and weighted average of 12.6%, a difference of 19.9%.
Seniors Poverty Over the Age of 65 Correlation Summary
| Measurement | Portuguese | Immigrants from Somalia |
| Minimum | 0.21% | 4.8% |
| Maximum | 25.7% | 67.5% |
| Range | 25.5% | 62.7% |
| Mean | 11.3% | 13.6% |
| Median | 10.6% | 11.1% |
| Interquartile 25% (IQ1) | 8.5% | 9.3% |
| Interquartile 75% (IQ3) | 13.4% | 14.9% |
| Interquartile Range (IQR) | 4.8% | 5.7% |
| Standard Deviation (Sample) | 4.9% | 8.8% |
| Standard Deviation (Population) | 4.9% | 8.7% |
Similar Demographics by Seniors Poverty Over the Age of 65
Demographics Similar to Portuguese by Seniors Poverty Over the Age of 65
In terms of seniors poverty over the age of 65, the demographic groups most similar to Portuguese are Immigrants from Latvia (10.5%, a difference of 0.10%), Immigrants from Kenya (10.5%, a difference of 0.13%), Immigrants from Europe (10.5%, a difference of 0.15%), Immigrants from Australia (10.5%, a difference of 0.16%), and Osage (10.6%, a difference of 0.22%).
| Demographics | Rating | Rank | Seniors Poverty Over the Age of 65 |
| Immigrants | Turkey | 87.7 /100 | #132 | Excellent 10.5% |
| Guamanians/Chamorros | 87.5 /100 | #133 | Excellent 10.5% |
| Sierra Leoneans | 86.8 /100 | #134 | Excellent 10.5% |
| Immigrants | Norway | 86.5 /100 | #135 | Excellent 10.5% |
| Immigrants | Serbia | 86.4 /100 | #136 | Excellent 10.5% |
| Immigrants | Australia | 85.1 /100 | #137 | Excellent 10.5% |
| Immigrants | Latvia | 84.7 /100 | #138 | Excellent 10.5% |
| Portuguese | 84.1 /100 | #139 | Excellent 10.5% |
| Immigrants | Kenya | 83.4 /100 | #140 | Excellent 10.5% |
| Immigrants | Europe | 83.3 /100 | #141 | Excellent 10.5% |
| Osage | 82.8 /100 | #142 | Excellent 10.6% |
| Immigrants | Asia | 80.8 /100 | #143 | Excellent 10.6% |
| Iraqis | 80.7 /100 | #144 | Excellent 10.6% |
| Laotians | 79.9 /100 | #145 | Good 10.6% |
| Alaskan Athabascans | 79.1 /100 | #146 | Good 10.6% |
Demographics Similar to Immigrants from Somalia by Seniors Poverty Over the Age of 65
In terms of seniors poverty over the age of 65, the demographic groups most similar to Immigrants from Somalia are Blackfeet (12.6%, a difference of 0.10%), African (12.6%, a difference of 0.24%), Immigrants from Western Africa (12.6%, a difference of 0.41%), Inupiat (12.6%, a difference of 0.50%), and Soviet Union (12.6%, a difference of 0.57%).
| Demographics | Rating | Rank | Seniors Poverty Over the Age of 65 |
| Colombians | 0.2 /100 | #261 | Tragic 12.5% |
| Venezuelans | 0.1 /100 | #262 | Tragic 12.5% |
| Soviet Union | 0.1 /100 | #263 | Tragic 12.6% |
| Inupiat | 0.1 /100 | #264 | Tragic 12.6% |
| Immigrants | Western Africa | 0.1 /100 | #265 | Tragic 12.6% |
| Africans | 0.1 /100 | #266 | Tragic 12.6% |
| Blackfeet | 0.1 /100 | #267 | Tragic 12.6% |
| Immigrants | Somalia | 0.1 /100 | #268 | Tragic 12.6% |
| Immigrants | Venezuela | 0.1 /100 | #269 | Tragic 12.7% |
| Immigrants | South America | 0.1 /100 | #270 | Tragic 12.7% |
| Immigrants | Ghana | 0.1 /100 | #271 | Tragic 12.8% |
| Immigrants | Uruguay | 0.1 /100 | #272 | Tragic 12.8% |
| Kiowa | 0.0 /100 | #273 | Tragic 12.8% |
| Salvadorans | 0.0 /100 | #274 | Tragic 12.8% |
| Immigrants | Colombia | 0.0 /100 | #275 | Tragic 12.9% |