Pennsylvania German vs Subsaharan African Seniors Poverty Over the Age of 65
COMPARE
Pennsylvania German
Subsaharan African
Seniors Poverty Over the Age of 65
Seniors Poverty Over the Age of 65 Comparison
Pennsylvania Germans
Sub-Saharan Africans
9.9%
SENIORS POVERTY OVER THE AGE OF 65
98.7/ 100
METRIC RATING
65th/ 347
METRIC RANK
12.1%
SENIORS POVERTY OVER THE AGE OF 65
0.9/ 100
METRIC RATING
242nd/ 347
METRIC RANK
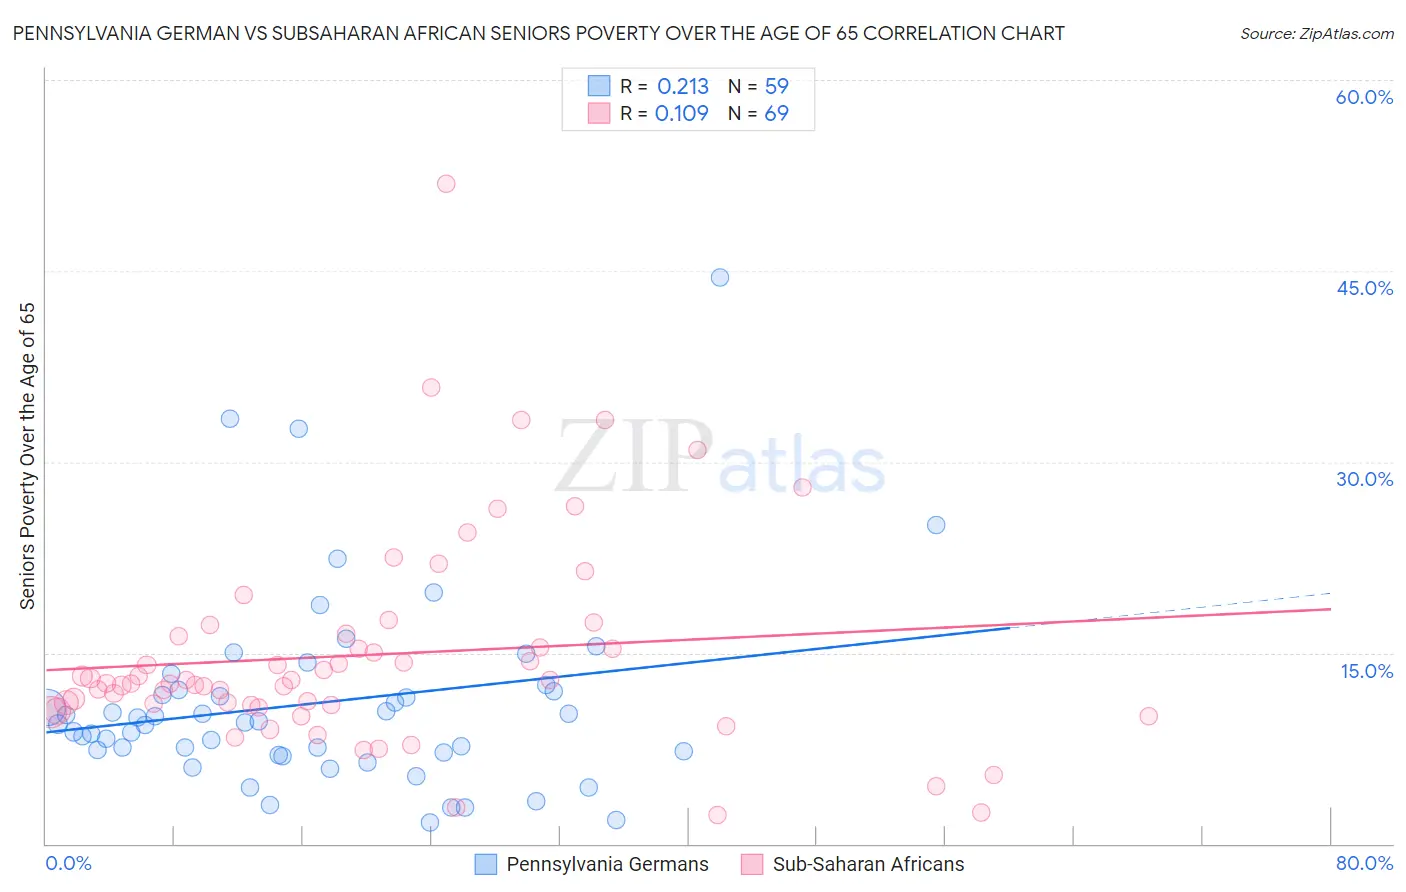
Pennsylvania German vs Subsaharan African Seniors Poverty Over the Age of 65 Correlation Chart
The statistical analysis conducted on geographies consisting of 233,607,294 people shows a weak positive correlation between the proportion of Pennsylvania Germans and poverty level among seniors over the age of 65 in the United States with a correlation coefficient (R) of 0.213 and weighted average of 9.9%. Similarly, the statistical analysis conducted on geographies consisting of 505,238,061 people shows a poor positive correlation between the proportion of Sub-Saharan Africans and poverty level among seniors over the age of 65 in the United States with a correlation coefficient (R) of 0.109 and weighted average of 12.1%, a difference of 22.2%.
Seniors Poverty Over the Age of 65 Correlation Summary
| Measurement | Pennsylvania German | Subsaharan African |
| Minimum | 1.7% | 2.2% |
| Maximum | 44.4% | 51.9% |
| Range | 42.7% | 49.6% |
| Mean | 11.1% | 14.8% |
| Median | 9.6% | 12.6% |
| Interquartile 25% (IQ1) | 7.2% | 10.8% |
| Interquartile 75% (IQ3) | 12.0% | 16.4% |
| Interquartile Range (IQR) | 4.9% | 5.6% |
| Standard Deviation (Sample) | 7.7% | 8.4% |
| Standard Deviation (Population) | 7.6% | 8.3% |
Similar Demographics by Seniors Poverty Over the Age of 65
Demographics Similar to Pennsylvania Germans by Seniors Poverty Over the Age of 65
In terms of seniors poverty over the age of 65, the demographic groups most similar to Pennsylvania Germans are Immigrants from Netherlands (9.9%, a difference of 0.050%), Immigrants from Austria (9.9%, a difference of 0.15%), Immigrants from North America (9.9%, a difference of 0.28%), Macedonian (9.9%, a difference of 0.33%), and Canadian (9.9%, a difference of 0.37%).
| Demographics | Rating | Rank | Seniors Poverty Over the Age of 65 |
| Serbians | 99.1 /100 | #58 | Exceptional 9.8% |
| Immigrants | Canada | 99.0 /100 | #59 | Exceptional 9.8% |
| Celtics | 99.0 /100 | #60 | Exceptional 9.8% |
| Iranians | 98.9 /100 | #61 | Exceptional 9.8% |
| French Canadians | 98.9 /100 | #62 | Exceptional 9.8% |
| Macedonians | 98.8 /100 | #63 | Exceptional 9.9% |
| Immigrants | North America | 98.8 /100 | #64 | Exceptional 9.9% |
| Pennsylvania Germans | 98.7 /100 | #65 | Exceptional 9.9% |
| Immigrants | Netherlands | 98.7 /100 | #66 | Exceptional 9.9% |
| Immigrants | Austria | 98.6 /100 | #67 | Exceptional 9.9% |
| Canadians | 98.5 /100 | #68 | Exceptional 9.9% |
| Australians | 98.4 /100 | #69 | Exceptional 9.9% |
| Samoans | 98.0 /100 | #70 | Exceptional 10.0% |
| Yugoslavians | 97.9 /100 | #71 | Exceptional 10.0% |
| Palestinians | 97.9 /100 | #72 | Exceptional 10.0% |
Demographics Similar to Sub-Saharan Africans by Seniors Poverty Over the Age of 65
In terms of seniors poverty over the age of 65, the demographic groups most similar to Sub-Saharan Africans are Immigrants from Albania (12.1%, a difference of 0.040%), Comanche (12.1%, a difference of 0.060%), Uruguayan (12.1%, a difference of 0.12%), Immigrants from Spain (12.1%, a difference of 0.16%), and Immigrants from Portugal (12.1%, a difference of 0.34%).
| Demographics | Rating | Rank | Seniors Poverty Over the Age of 65 |
| Immigrants | Argentina | 1.3 /100 | #235 | Tragic 12.0% |
| Immigrants | Peru | 1.3 /100 | #236 | Tragic 12.0% |
| Moroccans | 1.2 /100 | #237 | Tragic 12.0% |
| Seminole | 1.1 /100 | #238 | Tragic 12.0% |
| Immigrants | Spain | 1.0 /100 | #239 | Tragic 12.1% |
| Comanche | 0.9 /100 | #240 | Tragic 12.1% |
| Immigrants | Albania | 0.9 /100 | #241 | Tragic 12.1% |
| Sub-Saharan Africans | 0.9 /100 | #242 | Tragic 12.1% |
| Uruguayans | 0.8 /100 | #243 | Tragic 12.1% |
| Immigrants | Portugal | 0.8 /100 | #244 | Tragic 12.1% |
| Chippewa | 0.7 /100 | #245 | Tragic 12.1% |
| Cree | 0.7 /100 | #246 | Tragic 12.1% |
| Japanese | 0.6 /100 | #247 | Tragic 12.2% |
| Spanish Americans | 0.6 /100 | #248 | Tragic 12.2% |
| Ute | 0.6 /100 | #249 | Tragic 12.2% |