Paiute vs Costa Rican Single Father Poverty
COMPARE
Paiute
Costa Rican
Single Father Poverty
Single Father Poverty Comparison
Paiute
Costa Ricans
21.6%
SINGLE FATHER POVERTY
0.0/ 100
METRIC RATING
330th/ 347
METRIC RANK
16.3%
SINGLE FATHER POVERTY
53.6/ 100
METRIC RATING
168th/ 347
METRIC RANK
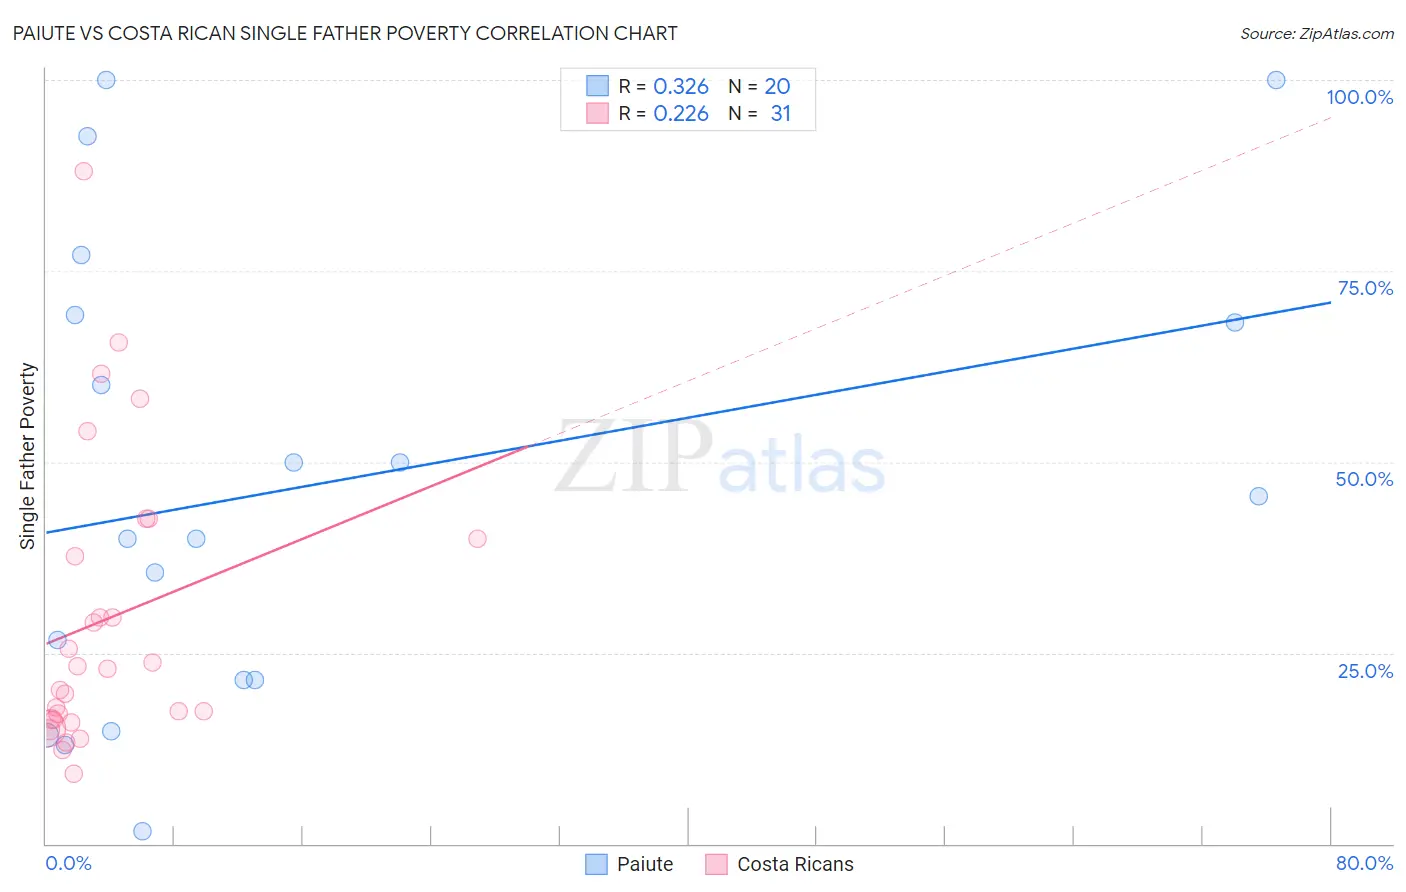
Paiute vs Costa Rican Single Father Poverty Correlation Chart
The statistical analysis conducted on geographies consisting of 54,887,745 people shows a mild positive correlation between the proportion of Paiute and poverty level among single fathers in the United States with a correlation coefficient (R) of 0.326 and weighted average of 21.6%. Similarly, the statistical analysis conducted on geographies consisting of 214,282,410 people shows a weak positive correlation between the proportion of Costa Ricans and poverty level among single fathers in the United States with a correlation coefficient (R) of 0.226 and weighted average of 16.3%, a difference of 32.9%.
Single Father Poverty Correlation Summary
| Measurement | Paiute | Costa Rican |
| Minimum | 1.6% | 9.2% |
| Maximum | 100.0% | 88.0% |
| Range | 98.4% | 78.8% |
| Mean | 47.1% | 29.4% |
| Median | 42.7% | 23.0% |
| Interquartile 25% (IQ1) | 21.4% | 16.2% |
| Interquartile 75% (IQ3) | 68.7% | 40.0% |
| Interquartile Range (IQR) | 47.3% | 23.8% |
| Standard Deviation (Sample) | 29.9% | 18.9% |
| Standard Deviation (Population) | 29.2% | 18.6% |
Similar Demographics by Single Father Poverty
Demographics Similar to Paiute by Single Father Poverty
In terms of single father poverty, the demographic groups most similar to Paiute are Central American Indian (21.7%, a difference of 0.27%), Colville (21.4%, a difference of 1.3%), Tohono O'odham (22.0%, a difference of 1.8%), Pueblo (21.1%, a difference of 2.4%), and Native/Alaskan (22.4%, a difference of 3.5%).
| Demographics | Rating | Rank | Single Father Poverty |
| Pennsylvania Germans | 0.0 /100 | #323 | Tragic 20.0% |
| Americans | 0.0 /100 | #324 | Tragic 20.1% |
| Blacks/African Americans | 0.0 /100 | #325 | Tragic 20.4% |
| Immigrants | Yemen | 0.0 /100 | #326 | Tragic 20.6% |
| Choctaw | 0.0 /100 | #327 | Tragic 20.7% |
| Pueblo | 0.0 /100 | #328 | Tragic 21.1% |
| Colville | 0.0 /100 | #329 | Tragic 21.4% |
| Paiute | 0.0 /100 | #330 | Tragic 21.6% |
| Central American Indians | 0.0 /100 | #331 | Tragic 21.7% |
| Tohono O'odham | 0.0 /100 | #332 | Tragic 22.0% |
| Natives/Alaskans | 0.0 /100 | #333 | Tragic 22.4% |
| Kiowa | 0.0 /100 | #334 | Tragic 22.5% |
| Shoshone | 0.0 /100 | #335 | Tragic 22.9% |
| Cajuns | 0.0 /100 | #336 | Tragic 23.1% |
| Sioux | 0.0 /100 | #337 | Tragic 23.9% |
Demographics Similar to Costa Ricans by Single Father Poverty
In terms of single father poverty, the demographic groups most similar to Costa Ricans are Yugoslavian (16.3%, a difference of 0.010%), Northern European (16.3%, a difference of 0.040%), Immigrants from Europe (16.3%, a difference of 0.050%), Scandinavian (16.3%, a difference of 0.060%), and Guyanese (16.3%, a difference of 0.070%).
| Demographics | Rating | Rank | Single Father Poverty |
| Estonians | 56.7 /100 | #161 | Average 16.2% |
| Ugandans | 55.9 /100 | #162 | Average 16.3% |
| Immigrants | Costa Rica | 55.7 /100 | #163 | Average 16.3% |
| Guyanese | 55.2 /100 | #164 | Average 16.3% |
| Immigrants | Bangladesh | 55.1 /100 | #165 | Average 16.3% |
| Immigrants | Europe | 54.8 /100 | #166 | Average 16.3% |
| Yugoslavians | 53.9 /100 | #167 | Average 16.3% |
| Costa Ricans | 53.6 /100 | #168 | Average 16.3% |
| Northern Europeans | 52.8 /100 | #169 | Average 16.3% |
| Scandinavians | 52.3 /100 | #170 | Average 16.3% |
| Immigrants | Morocco | 50.7 /100 | #171 | Average 16.3% |
| Immigrants | Sierra Leone | 50.1 /100 | #172 | Average 16.3% |
| Immigrants | St. Vincent and the Grenadines | 50.0 /100 | #173 | Average 16.3% |
| Swedes | 50.0 /100 | #174 | Average 16.3% |
| Immigrants | Ecuador | 49.7 /100 | #175 | Average 16.3% |