Okinawan vs Immigrants from Western Europe Male Poverty

COMPARE

Okinawan
Race
Ancestry
AfghanAfricanAlaska NativeAlaskan AthabascanAlbanianAleutAlsatianAmericanApacheArabArapahoArgentineanArmenianAssyrian/Chaldean/SyriacAustralianAustrianBahamianBangladeshiBarbadianBasqueBelgianBelizeanBermudanBhutaneseBlackfeetBolivianBrazilianBritishBritish West IndianBulgarianBurmeseCajunCambodianCanadianCape VerdeanCarpatho RusynCelticCentral AmericanCentral American IndianCherokeeCheyenneChickasawChileanChineseChippewaChoctawColombianColvilleComancheCosta RicanCreeCreekCroatianCrowCubanCypriotCzechCzechoslovakianDanishDelawareDominicanDutchDutch West IndianEastern EuropeanEcuadorianEgyptianEnglishEstonianEthiopianEuropeanFijianFilipinoFinnishFrenchFrench American IndianFrench CanadianGermanGerman RussianGhanaianGreekGuamanian/ChamorroGuatemalanGuyaneseHaitianHmongHonduranHopiHoumaHungarianIcelanderIndian (Asian)IndonesianInupiatIranianIraqiIrishIroquoisIsraeliItalianJamaicanJapaneseJordanianKenyanKiowaKoreanLaotianLatvianLebaneseLiberianLithuanianLumbeeLuxembourgerMacedonianMalaysianMalteseMarshalleseMenomineeMexicanMexican American IndianMongolianMoroccanNative HawaiianNavajoNepaleseNew ZealanderNicaraguanNigerianNorthern EuropeanNorwegianOkinawanOsageOttawaPaiutePakistaniPalestinianPanamanianParaguayanPennsylvania GermanPeruvianPimaPolishPortuguesePotawatomiPuebloPuerto RicanPuget Sound SalishRomanianRussianSalvadoranSamoanScandinavianScotch-IrishScottishSeminoleSenegaleseSerbianShoshoneSierra LeoneanSiouxSlavicSlovakSloveneSomaliSouth AfricanSouth AmericanSouth American IndianSoviet UnionSpaniardSpanishSpanish AmericanSpanish American IndianSri LankanSubsaharan AfricanSudaneseSwedishSwissSyrianTaiwaneseThaiTlingit-HaidaTohono O'OdhamTonganTrinidadian and TobagonianTsimshianTurkishU.S. Virgin IslanderUgandanUkrainianUruguayanUteVenezuelanVietnameseWelshWest IndianYakamaYaquiYugoslavianYumanYup'ikZimbabwean
Immigration
NonimmigrantsImmigrantsAfghanistanAfricaAlbaniaArgentinaArmeniaAsiaAustraliaAustriaBahamasBangladeshBarbadosBelarusBelgiumBelizeBoliviaBosnia and HerzegovinaBrazilBulgariaBurma/MyanmarCabo VerdeCambodiaCameroonCanadaCaribbeanCentral AmericaChileChinaColombiaCongoCosta RicaCroatiaCubaCzechoslovakiaDenmarkDominicaDominican RepublicEastern AfricaEastern AsiaEastern EuropeEcuadorEgyptEl SalvadorEnglandEritreaEthiopiaEuropeFijiFranceGermanyGhanaGreeceGrenadaGuatemalaGuyanaHaitiHondurasHong KongHungaryIndiaIndonesiaIranIraqIrelandIsraelItalyJamaicaJapanJordanKazakhstanKenyaKoreaKuwaitLaosLatin AmericaLatviaLebanonLiberiaLithuaniaMalaysiaMexicoMicronesiaMiddle AfricaMoldovaMoroccoNepalNetherlandsNicaraguaNigeriaNorth AmericaNorth MacedoniaNorthern AfricaNorthern EuropeNorwayOceaniaPakistanPanamaPeruPhilippinesPolandPortugalRomaniaRussiaSaudi ArabiaScotlandSenegalSerbiaSierra LeoneSingaporeSomaliaSouth AfricaSouth AmericaSouth Central AsiaSouth Eastern AsiaSouthern EuropeSpainSri LankaSt. Vincent and the GrenadinesSudanSwedenSwitzerlandSyriaTaiwanThailandTrinidad and TobagoTurkeyUgandaUkraineUruguayUzbekistanVenezuelaVietnamWest IndiesWestern AfricaWestern AsiaYemenZaireZimbabweAzores
Immigrants from Western Europe
Race
Ancestry
AfghanAfricanAlaska NativeAlaskan AthabascanAlbanianAleutAlsatianAmericanApacheArabArapahoArgentineanArmenianAssyrian/Chaldean/SyriacAustralianAustrianBahamianBangladeshiBarbadianBasqueBelgianBelizeanBermudanBhutaneseBlackfeetBolivianBrazilianBritishBritish West IndianBulgarianBurmeseCajunCambodianCanadianCape VerdeanCarpatho RusynCelticCentral AmericanCentral American IndianCherokeeCheyenneChickasawChileanChineseChippewaChoctawColombianColvilleComancheCosta RicanCreeCreekCroatianCrowCubanCypriotCzechCzechoslovakianDanishDelawareDominicanDutchDutch West IndianEastern EuropeanEcuadorianEgyptianEnglishEstonianEthiopianEuropeanFijianFilipinoFinnishFrenchFrench American IndianFrench CanadianGermanGerman RussianGhanaianGreekGuamanian/ChamorroGuatemalanGuyaneseHaitianHmongHonduranHopiHoumaHungarianIcelanderIndian (Asian)IndonesianInupiatIranianIraqiIrishIroquoisIsraeliItalianJamaicanJapaneseJordanianKenyanKiowaKoreanLaotianLatvianLebaneseLiberianLithuanianLumbeeLuxembourgerMacedonianMalaysianMalteseMarshalleseMenomineeMexicanMexican American IndianMongolianMoroccanNative HawaiianNavajoNepaleseNew ZealanderNicaraguanNigerianNorthern EuropeanNorwegianOsageOttawaPaiutePakistaniPalestinianPanamanianParaguayanPennsylvania GermanPeruvianPimaPolishPortuguesePotawatomiPuebloPuerto RicanPuget Sound SalishRomanianRussianSalvadoranSamoanScandinavianScotch-IrishScottishSeminoleSenegaleseSerbianShoshoneSierra LeoneanSiouxSlavicSlovakSloveneSomaliSouth AfricanSouth AmericanSouth American IndianSoviet UnionSpaniardSpanishSpanish AmericanSpanish American IndianSri LankanSubsaharan AfricanSudaneseSwedishSwissSyrianTaiwaneseThaiTlingit-HaidaTohono O'OdhamTonganTrinidadian and TobagonianTsimshianTurkishU.S. Virgin IslanderUgandanUkrainianUruguayanUteVenezuelanVietnameseWelshWest IndianYakamaYaquiYugoslavianYumanYup'ikZimbabwean
Immigration
NonimmigrantsImmigrantsAfghanistanAfricaAlbaniaArgentinaArmeniaAsiaAustraliaAustriaBahamasBangladeshBarbadosBelarusBelgiumBelizeBoliviaBosnia and HerzegovinaBrazilBulgariaBurma/MyanmarCabo VerdeCambodiaCameroonCanadaCaribbeanCentral AmericaChileChinaColombiaCongoCosta RicaCroatiaCubaCzechoslovakiaDenmarkDominicaDominican RepublicEastern AfricaEastern AsiaEastern EuropeEcuadorEgyptEl SalvadorEnglandEritreaEthiopiaEuropeFijiFranceGermanyGhanaGreeceGrenadaGuatemalaGuyanaHaitiHondurasHong KongHungaryIndiaIndonesiaIranIraqIrelandIsraelItalyJamaicaJapanJordanKazakhstanKenyaKoreaKuwaitLaosLatin AmericaLatviaLebanonLiberiaLithuaniaMalaysiaMexicoMicronesiaMiddle AfricaMoldovaMoroccoNepalNetherlandsNicaraguaNigeriaNorth AmericaNorth MacedoniaNorthern AfricaNorthern EuropeNorwayOceaniaPakistanPanamaPeruPhilippinesPolandPortugalRomaniaRussiaSaudi ArabiaScotlandSenegalSerbiaSierra LeoneSingaporeSomaliaSouth AfricaSouth AmericaSouth Central AsiaSouth Eastern AsiaSouthern EuropeSpainSri LankaSt. Vincent and the GrenadinesSudanSwedenSwitzerlandSyriaTaiwanThailandTrinidad and TobagoTurkeyUgandaUkraineUruguayUzbekistanVenezuelaVietnamWest IndiesWestern AfricaWestern AsiaWestern EuropeYemenZaireZimbabweAzores
Male Poverty
Income
Poverty
Unemployment
Labor Participation
Family Structure
Vehicle Availability
Education Level
Disability

Male Poverty Comparison

Okinawans

Immigrants from Western Europe

Excellent
Excellent
10.7%
MALE POVERTY
87.6/ 100
METRIC RATING
118th/ 347
METRIC RANK
10.7%
MALE POVERTY
84.2/ 100
METRIC RATING
128th/ 347
METRIC RANK

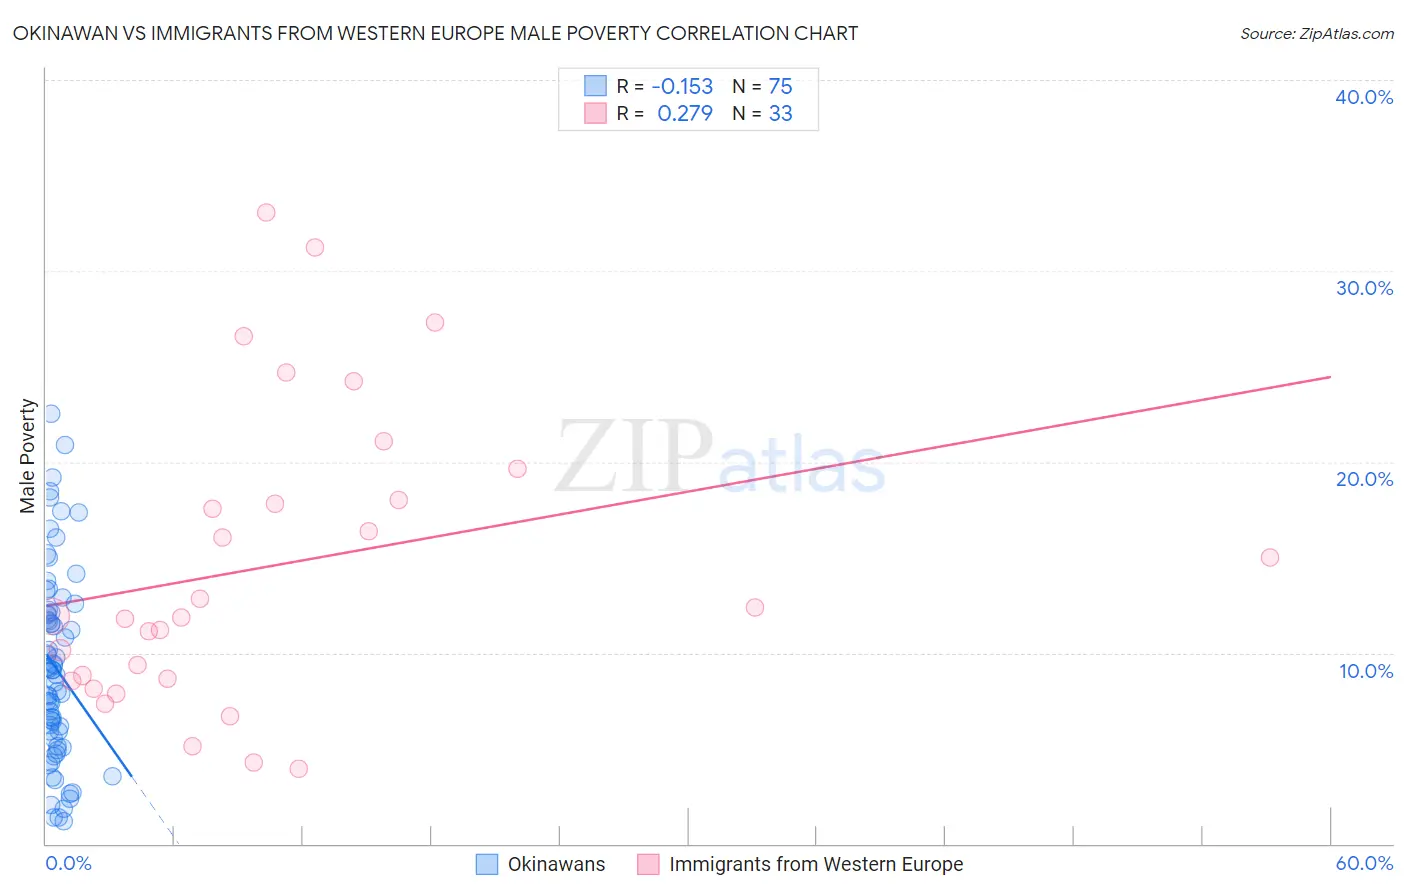
Okinawan vs Immigrants from Western Europe Male Poverty Correlation Chart

The statistical analysis conducted on geographies consisting of 73,717,243 people shows a poor negative correlation between the proportion of Okinawans and poverty level among males in the United States with a correlation coefficient (R) of -0.153 and weighted average of 10.7%. Similarly, the statistical analysis conducted on geographies consisting of 493,468,603 people shows a weak positive correlation between the proportion of Immigrants from Western Europe and poverty level among males in the United States with a correlation coefficient (R) of 0.279 and weighted average of 10.7%, a difference of 0.72%.
Okinawan vs Immigrants from Western Europe Male Poverty

Male Poverty Correlation Summary

MeasurementOkinawanImmigrants from Western Europe
Minimum1.2%3.9%
Maximum22.5%33.1%
Range21.3%29.2%
Mean9.2%14.6%
Median9.1%11.9%
Interquartile 25% (IQ1)5.5%8.6%
Interquartile 75% (IQ3)12.1%18.8%
Interquartile Range (IQR)6.6%10.2%
Standard Deviation (Sample)5.0%7.8%
Standard Deviation (Population)4.9%7.7%

Demographics Similar to Okinawans and Immigrants from Western Europe by Male Poverty

In terms of male poverty, the demographic groups most similar to Okinawans are Immigrants from Hungary (10.7%, a difference of 0.010%), Immigrants from South Eastern Asia (10.6%, a difference of 0.11%), Immigrants from China (10.7%, a difference of 0.11%), Sri Lankan (10.6%, a difference of 0.12%), and Peruvian (10.7%, a difference of 0.12%). Similarly, the demographic groups most similar to Immigrants from Western Europe are Immigrants from Peru (10.7%, a difference of 0.010%), Immigrants from Ukraine (10.7%, a difference of 0.020%), Puget Sound Salish (10.7%, a difference of 0.020%), Chilean (10.7%, a difference of 0.060%), and Immigrants from Belarus (10.7%, a difference of 0.17%).
DemographicsRating | RankMale Poverty
Palestinians
89.1
/100
|
#113
Excellent
10.6%
Immigrants | Brazil
89.0
/100
|
#114
Excellent
10.6%
Immigrants | Russia
88.6
/100
|
#115
Excellent
10.6%
Sri Lankans
88.1
/100
|
#116
Excellent
10.6%
Immigrants | South Eastern Asia
88.1
/100
|
#117
Excellent
10.6%
Okinawans
87.6
/100
|
#118
Excellent
10.7%
Immigrants | Hungary
87.6
/100
|
#119
Excellent
10.7%
Immigrants | China
87.1
/100
|
#120
Excellent
10.7%
Peruvians
87.1
/100
|
#121
Excellent
10.7%
Native Hawaiians
87.0
/100
|
#122
Excellent
10.7%
South Africans
86.8
/100
|
#123
Excellent
10.7%
French
86.7
/100
|
#124
Excellent
10.7%
Immigrants | Norway
86.0
/100
|
#125
Excellent
10.7%
Immigrants | Ukraine
84.3
/100
|
#126
Excellent
10.7%
Puget Sound Salish
84.3
/100
|
#127
Excellent
10.7%
Immigrants | Western Europe
84.2
/100
|
#128
Excellent
10.7%
Immigrants | Peru
84.1
/100
|
#129
Excellent
10.7%
Chileans
83.9
/100
|
#130
Excellent
10.7%
Immigrants | Belarus
83.3
/100
|
#131
Excellent
10.7%
Immigrants | Vietnam
83.0
/100
|
#132
Excellent
10.8%
Pakistanis
83.0
/100
|
#133
Excellent
10.8%