Okinawan vs Immigrants from Trinidad and Tobago Poverty
COMPARE
Okinawan
Immigrants from Trinidad and Tobago
Poverty
Poverty Comparison
Okinawans
Immigrants from Trinidad and Tobago
11.6%
POVERTY
92.4/ 100
METRIC RATING
103rd/ 347
METRIC RANK
14.2%
POVERTY
0.2/ 100
METRIC RATING
253rd/ 347
METRIC RANK
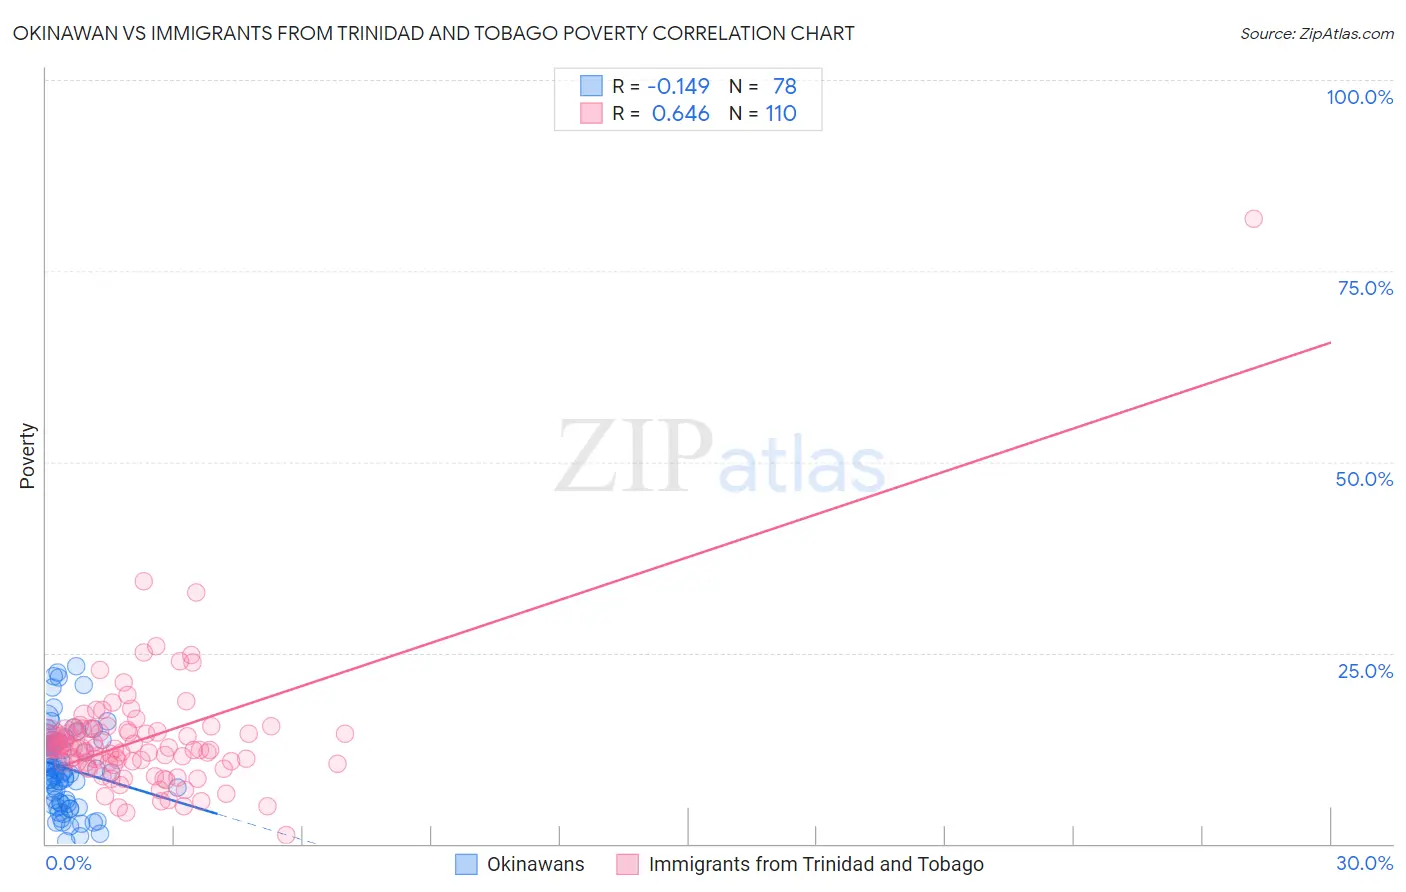
Okinawan vs Immigrants from Trinidad and Tobago Poverty Correlation Chart
The statistical analysis conducted on geographies consisting of 73,736,357 people shows a poor negative correlation between the proportion of Okinawans and poverty level in the United States with a correlation coefficient (R) of -0.149 and weighted average of 11.6%. Similarly, the statistical analysis conducted on geographies consisting of 223,476,613 people shows a significant positive correlation between the proportion of Immigrants from Trinidad and Tobago and poverty level in the United States with a correlation coefficient (R) of 0.646 and weighted average of 14.2%, a difference of 23.1%.
Poverty Correlation Summary
| Measurement | Okinawan | Immigrants from Trinidad and Tobago |
| Minimum | 0.28% | 1.1% |
| Maximum | 23.2% | 81.9% |
| Range | 22.9% | 80.8% |
| Mean | 9.9% | 13.7% |
| Median | 9.4% | 12.5% |
| Interquartile 25% (IQ1) | 5.4% | 10.6% |
| Interquartile 75% (IQ3) | 13.3% | 14.9% |
| Interquartile Range (IQR) | 7.9% | 4.3% |
| Standard Deviation (Sample) | 5.4% | 8.4% |
| Standard Deviation (Population) | 5.4% | 8.4% |
Similar Demographics by Poverty
Demographics Similar to Okinawans by Poverty
In terms of poverty, the demographic groups most similar to Okinawans are Laotian (11.6%, a difference of 0.010%), Native Hawaiian (11.6%, a difference of 0.11%), Portuguese (11.6%, a difference of 0.13%), Immigrants from Zimbabwe (11.6%, a difference of 0.13%), and Palestinian (11.6%, a difference of 0.22%).
| Demographics | Rating | Rank | Poverty |
| Immigrants | South Africa | 94.7 /100 | #96 | Exceptional 11.5% |
| Immigrants | Egypt | 94.6 /100 | #97 | Exceptional 11.5% |
| Immigrants | Latvia | 94.5 /100 | #98 | Exceptional 11.5% |
| Immigrants | Indonesia | 94.2 /100 | #99 | Exceptional 11.5% |
| Scottish | 94.0 /100 | #100 | Exceptional 11.5% |
| Slavs | 93.3 /100 | #101 | Exceptional 11.5% |
| Laotians | 92.4 /100 | #102 | Exceptional 11.6% |
| Okinawans | 92.4 /100 | #103 | Exceptional 11.6% |
| Native Hawaiians | 92.1 /100 | #104 | Exceptional 11.6% |
| Portuguese | 92.1 /100 | #105 | Exceptional 11.6% |
| Immigrants | Zimbabwe | 92.1 /100 | #106 | Exceptional 11.6% |
| Palestinians | 91.8 /100 | #107 | Exceptional 11.6% |
| Canadians | 91.7 /100 | #108 | Exceptional 11.6% |
| Immigrants | Turkey | 91.7 /100 | #109 | Exceptional 11.6% |
| Welsh | 91.6 /100 | #110 | Exceptional 11.6% |
Demographics Similar to Immigrants from Trinidad and Tobago by Poverty
In terms of poverty, the demographic groups most similar to Immigrants from Trinidad and Tobago are Spanish American Indian (14.2%, a difference of 0.10%), Immigrants from Burma/Myanmar (14.2%, a difference of 0.22%), Immigrants from El Salvador (14.3%, a difference of 0.25%), Cree (14.2%, a difference of 0.31%), and Immigrants from Ecuador (14.3%, a difference of 0.35%).
| Demographics | Rating | Rank | Poverty |
| Potawatomi | 0.3 /100 | #246 | Tragic 14.1% |
| Liberians | 0.2 /100 | #247 | Tragic 14.1% |
| Immigrants | Western Africa | 0.2 /100 | #248 | Tragic 14.1% |
| Immigrants | Ghana | 0.2 /100 | #249 | Tragic 14.2% |
| Cree | 0.2 /100 | #250 | Tragic 14.2% |
| Immigrants | Burma/Myanmar | 0.2 /100 | #251 | Tragic 14.2% |
| Spanish American Indians | 0.2 /100 | #252 | Tragic 14.2% |
| Immigrants | Trinidad and Tobago | 0.2 /100 | #253 | Tragic 14.2% |
| Immigrants | El Salvador | 0.1 /100 | #254 | Tragic 14.3% |
| Immigrants | Ecuador | 0.1 /100 | #255 | Tragic 14.3% |
| Mexican American Indians | 0.1 /100 | #256 | Tragic 14.3% |
| Trinidadians and Tobagonians | 0.1 /100 | #257 | Tragic 14.3% |
| Ottawa | 0.1 /100 | #258 | Tragic 14.3% |
| Immigrants | Nicaragua | 0.1 /100 | #259 | Tragic 14.3% |
| Cape Verdeans | 0.1 /100 | #260 | Tragic 14.4% |