Okinawan vs Immigrants from Malaysia Single Mother Poverty

COMPARE

Okinawan
Race
Ancestry
AfghanAfricanAlaska NativeAlaskan AthabascanAlbanianAleutAlsatianAmericanApacheArabArapahoArgentineanArmenianAssyrian/Chaldean/SyriacAustralianAustrianBahamianBangladeshiBarbadianBasqueBelgianBelizeanBermudanBhutaneseBlackfeetBolivianBrazilianBritishBritish West IndianBulgarianBurmeseCajunCambodianCanadianCape VerdeanCarpatho RusynCelticCentral AmericanCentral American IndianCherokeeCheyenneChickasawChileanChineseChippewaChoctawColombianColvilleComancheCosta RicanCreeCreekCroatianCrowCubanCypriotCzechCzechoslovakianDanishDelawareDominicanDutchDutch West IndianEastern EuropeanEcuadorianEgyptianEnglishEstonianEthiopianEuropeanFijianFilipinoFinnishFrenchFrench American IndianFrench CanadianGermanGerman RussianGhanaianGreekGuamanian/ChamorroGuatemalanGuyaneseHaitianHmongHonduranHopiHoumaHungarianIcelanderIndian (Asian)IndonesianInupiatIranianIraqiIrishIroquoisIsraeliItalianJamaicanJapaneseJordanianKenyanKiowaKoreanLaotianLatvianLebaneseLiberianLithuanianLumbeeLuxembourgerMacedonianMalaysianMalteseMarshalleseMenomineeMexicanMexican American IndianMongolianMoroccanNative HawaiianNavajoNepaleseNew ZealanderNicaraguanNigerianNorthern EuropeanNorwegianOkinawanOsageOttawaPaiutePakistaniPalestinianPanamanianParaguayanPennsylvania GermanPeruvianPimaPolishPortuguesePotawatomiPuebloPuerto RicanPuget Sound SalishRomanianRussianSalvadoranSamoanScandinavianScotch-IrishScottishSeminoleSenegaleseSerbianShoshoneSierra LeoneanSiouxSlavicSlovakSloveneSomaliSouth AfricanSouth AmericanSouth American IndianSoviet UnionSpaniardSpanishSpanish AmericanSpanish American IndianSri LankanSubsaharan AfricanSudaneseSwedishSwissSyrianTaiwaneseThaiTlingit-HaidaTohono O'OdhamTonganTrinidadian and TobagonianTsimshianTurkishU.S. Virgin IslanderUgandanUkrainianUruguayanUteVenezuelanVietnameseWelshWest IndianYakamaYaquiYugoslavianYumanYup'ikZimbabwean
Immigration
NonimmigrantsImmigrantsAfghanistanAfricaAlbaniaArgentinaArmeniaAsiaAustraliaAustriaBahamasBangladeshBarbadosBelarusBelgiumBelizeBoliviaBosnia and HerzegovinaBrazilBulgariaBurma/MyanmarCabo VerdeCambodiaCameroonCanadaCaribbeanCentral AmericaChileChinaColombiaCongoCosta RicaCroatiaCubaCzechoslovakiaDenmarkDominicaDominican RepublicEastern AfricaEastern AsiaEastern EuropeEcuadorEgyptEl SalvadorEnglandEritreaEthiopiaEuropeFijiFranceGermanyGhanaGreeceGrenadaGuatemalaGuyanaHaitiHondurasHong KongHungaryIndiaIndonesiaIranIraqIrelandIsraelItalyJamaicaJapanJordanKazakhstanKenyaKoreaKuwaitLaosLatin AmericaLatviaLebanonLiberiaLithuaniaMexicoMicronesiaMiddle AfricaMoldovaMoroccoNepalNetherlandsNicaraguaNigeriaNorth AmericaNorth MacedoniaNorthern AfricaNorthern EuropeNorwayOceaniaPakistanPanamaPeruPhilippinesPolandPortugalRomaniaRussiaSaudi ArabiaScotlandSenegalSerbiaSierra LeoneSingaporeSomaliaSouth AfricaSouth AmericaSouth Central AsiaSouth Eastern AsiaSouthern EuropeSpainSri LankaSt. Vincent and the GrenadinesSudanSwedenSwitzerlandSyriaTaiwanThailandTrinidad and TobagoTurkeyUgandaUkraineUruguayUzbekistanVenezuelaVietnamWest IndiesWestern AfricaWestern AsiaWestern EuropeYemenZaireZimbabweAzores
Immigrants from Malaysia
Race
Ancestry
AfghanAfricanAlaska NativeAlaskan AthabascanAlbanianAleutAlsatianAmericanApacheArabArapahoArgentineanArmenianAssyrian/Chaldean/SyriacAustralianAustrianBahamianBangladeshiBarbadianBasqueBelgianBelizeanBermudanBhutaneseBlackfeetBolivianBrazilianBritishBritish West IndianBulgarianBurmeseCajunCambodianCanadianCape VerdeanCarpatho RusynCelticCentral AmericanCentral American IndianCherokeeCheyenneChickasawChileanChineseChippewaChoctawColombianColvilleComancheCosta RicanCreeCreekCroatianCrowCubanCypriotCzechCzechoslovakianDanishDelawareDominicanDutchDutch West IndianEastern EuropeanEcuadorianEgyptianEnglishEstonianEthiopianEuropeanFijianFilipinoFinnishFrenchFrench American IndianFrench CanadianGermanGerman RussianGhanaianGreekGuamanian/ChamorroGuatemalanGuyaneseHaitianHmongHonduranHopiHoumaHungarianIcelanderIndian (Asian)IndonesianInupiatIranianIraqiIrishIroquoisIsraeliItalianJamaicanJapaneseJordanianKenyanKiowaKoreanLaotianLatvianLebaneseLiberianLithuanianLumbeeLuxembourgerMacedonianMalaysianMalteseMarshalleseMenomineeMexicanMexican American IndianMongolianMoroccanNative HawaiianNavajoNepaleseNew ZealanderNicaraguanNigerianNorthern EuropeanNorwegianOsageOttawaPaiutePakistaniPalestinianPanamanianParaguayanPennsylvania GermanPeruvianPimaPolishPortuguesePotawatomiPuebloPuerto RicanPuget Sound SalishRomanianRussianSalvadoranSamoanScandinavianScotch-IrishScottishSeminoleSenegaleseSerbianShoshoneSierra LeoneanSiouxSlavicSlovakSloveneSomaliSouth AfricanSouth AmericanSouth American IndianSoviet UnionSpaniardSpanishSpanish AmericanSpanish American IndianSri LankanSubsaharan AfricanSudaneseSwedishSwissSyrianTaiwaneseThaiTlingit-HaidaTohono O'OdhamTonganTrinidadian and TobagonianTsimshianTurkishU.S. Virgin IslanderUgandanUkrainianUruguayanUteVenezuelanVietnameseWelshWest IndianYakamaYaquiYugoslavianYumanYup'ikZimbabwean
Immigration
NonimmigrantsImmigrantsAfghanistanAfricaAlbaniaArgentinaArmeniaAsiaAustraliaAustriaBahamasBangladeshBarbadosBelarusBelgiumBelizeBoliviaBosnia and HerzegovinaBrazilBulgariaBurma/MyanmarCabo VerdeCambodiaCameroonCanadaCaribbeanCentral AmericaChileChinaColombiaCongoCosta RicaCroatiaCubaCzechoslovakiaDenmarkDominicaDominican RepublicEastern AfricaEastern AsiaEastern EuropeEcuadorEgyptEl SalvadorEnglandEritreaEthiopiaEuropeFijiFranceGermanyGhanaGreeceGrenadaGuatemalaGuyanaHaitiHondurasHong KongHungaryIndiaIndonesiaIranIraqIrelandIsraelItalyJamaicaJapanJordanKazakhstanKenyaKoreaKuwaitLaosLatin AmericaLatviaLebanonLiberiaLithuaniaMalaysiaMexicoMicronesiaMiddle AfricaMoldovaMoroccoNepalNetherlandsNicaraguaNigeriaNorth AmericaNorth MacedoniaNorthern AfricaNorthern EuropeNorwayOceaniaPakistanPanamaPeruPhilippinesPolandPortugalRomaniaRussiaSaudi ArabiaScotlandSenegalSerbiaSierra LeoneSingaporeSomaliaSouth AfricaSouth AmericaSouth Central AsiaSouth Eastern AsiaSouthern EuropeSpainSri LankaSt. Vincent and the GrenadinesSudanSwedenSwitzerlandSyriaTaiwanThailandTrinidad and TobagoTurkeyUgandaUkraineUruguayUzbekistanVenezuelaVietnamWest IndiesWestern AfricaWestern AsiaWestern EuropeYemenZaireZimbabweAzores
Single Mother Poverty
Income
Poverty
Unemployment
Labor Participation
Family Structure
Vehicle Availability
Education Level
Disability

Single Mother Poverty Comparison

Okinawans

Immigrants from Malaysia

Exceptional
Exceptional
26.6%
SINGLE MOTHER POVERTY
99.9/ 100
METRIC RATING
36th/ 347
METRIC RANK
27.3%
SINGLE MOTHER POVERTY
99.5/ 100
METRIC RATING
62nd/ 347
METRIC RANK

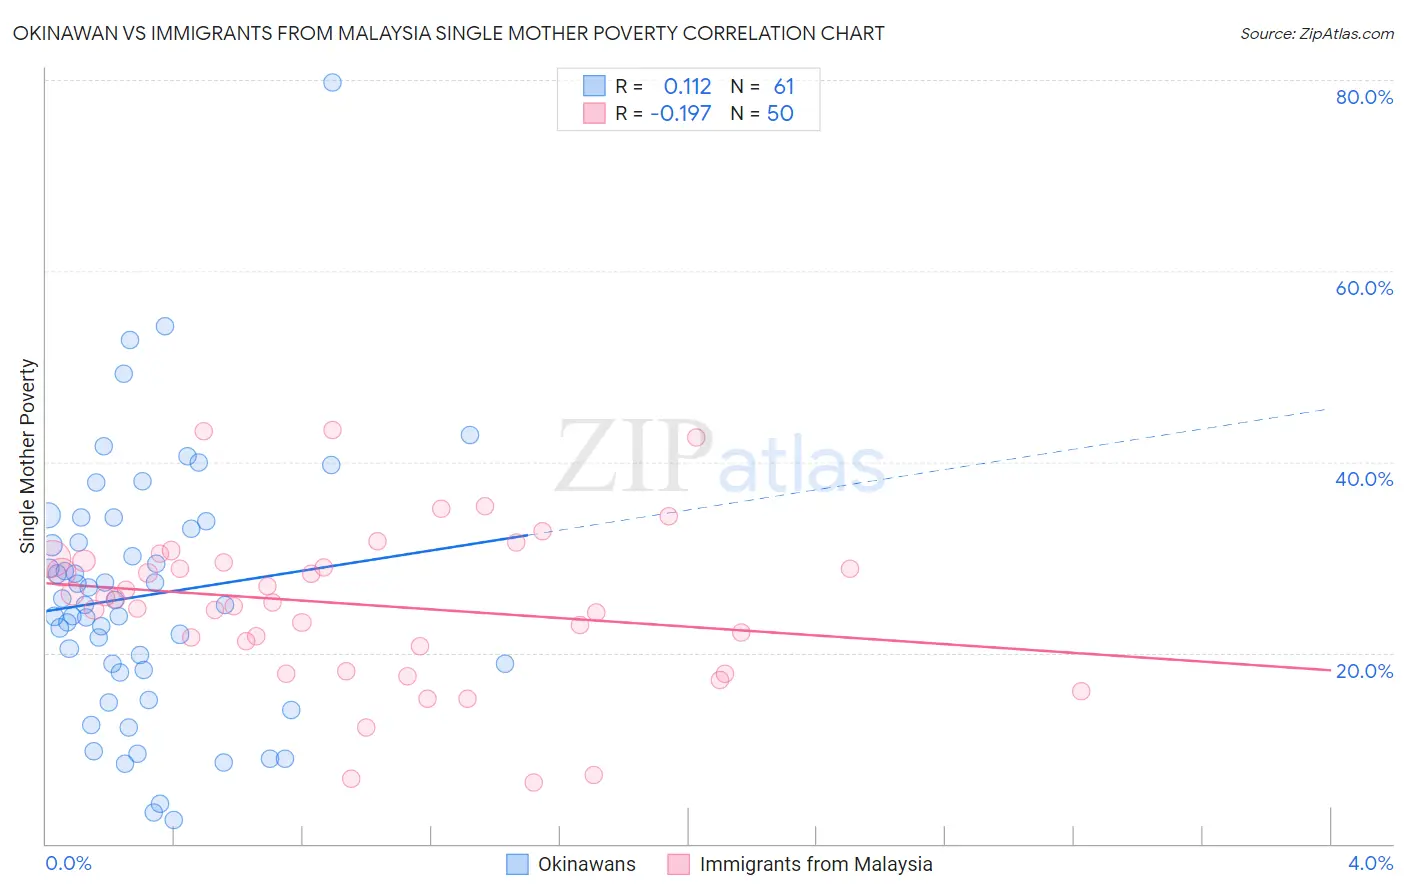
Okinawan vs Immigrants from Malaysia Single Mother Poverty Correlation Chart

The statistical analysis conducted on geographies consisting of 73,055,809 people shows a poor positive correlation between the proportion of Okinawans and poverty level among single mothers in the United States with a correlation coefficient (R) of 0.112 and weighted average of 26.6%. Similarly, the statistical analysis conducted on geographies consisting of 194,970,165 people shows a poor negative correlation between the proportion of Immigrants from Malaysia and poverty level among single mothers in the United States with a correlation coefficient (R) of -0.197 and weighted average of 27.3%, a difference of 2.6%.
Okinawan vs Immigrants from Malaysia Single Mother Poverty

Single Mother Poverty Correlation Summary

MeasurementOkinawanImmigrants from Malaysia
Minimum2.5%6.4%
Maximum79.7%43.4%
Range77.3%37.0%
Mean26.0%25.0%
Median25.0%25.4%
Interquartile 25% (IQ1)18.1%20.7%
Interquartile 75% (IQ3)33.4%29.6%
Interquartile Range (IQR)15.3%9.0%
Standard Deviation (Sample)13.7%8.3%
Standard Deviation (Population)13.6%8.3%

Similar Demographics by Single Mother Poverty

Demographics Similar to Okinawans by Single Mother Poverty

In terms of single mother poverty, the demographic groups most similar to Okinawans are Immigrants from Israel (26.6%, a difference of 0.0%), Immigrants from Fiji (26.6%, a difference of 0.040%), Maltese (26.6%, a difference of 0.050%), Immigrants from Indonesia (26.6%, a difference of 0.17%), and Bulgarian (26.5%, a difference of 0.18%).
DemographicsRating | RankSingle Mother Poverty
Jordanians
100.0
/100
|
#29
Exceptional
26.4%
Turks
100.0
/100
|
#30
Exceptional
26.4%
Immigrants | Philippines
100.0
/100
|
#31
Exceptional
26.5%
Tongans
99.9
/100
|
#32
Exceptional
26.5%
Bulgarians
99.9
/100
|
#33
Exceptional
26.5%
Immigrants | Indonesia
99.9
/100
|
#34
Exceptional
26.6%
Maltese
99.9
/100
|
#35
Exceptional
26.6%
Okinawans
99.9
/100
|
#36
Exceptional
26.6%
Immigrants | Israel
99.9
/100
|
#37
Exceptional
26.6%
Immigrants | Fiji
99.9
/100
|
#38
Exceptional
26.6%
Sri Lankans
99.9
/100
|
#39
Exceptional
26.7%
Immigrants | Vietnam
99.9
/100
|
#40
Exceptional
26.7%
Immigrants | Greece
99.9
/100
|
#41
Exceptional
26.7%
Armenians
99.9
/100
|
#42
Exceptional
26.8%
Tsimshian
99.9
/100
|
#43
Exceptional
26.8%

Demographics Similar to Immigrants from Malaysia by Single Mother Poverty

In terms of single mother poverty, the demographic groups most similar to Immigrants from Malaysia are Immigrants from Northern Europe (27.3%, a difference of 0.050%), Russian (27.3%, a difference of 0.080%), Immigrants from Eastern Europe (27.2%, a difference of 0.14%), Immigrants from Turkey (27.3%, a difference of 0.16%), and Soviet Union (27.3%, a difference of 0.19%).
DemographicsRating | RankSingle Mother Poverty
Immigrants | Egypt
99.7
/100
|
#55
Exceptional
27.1%
Immigrants | Romania
99.7
/100
|
#56
Exceptional
27.2%
Palestinians
99.7
/100
|
#57
Exceptional
27.2%
Argentineans
99.6
/100
|
#58
Exceptional
27.2%
Paraguayans
99.6
/100
|
#59
Exceptional
27.2%
Eastern Europeans
99.6
/100
|
#60
Exceptional
27.2%
Immigrants | Eastern Europe
99.6
/100
|
#61
Exceptional
27.2%
Immigrants | Malaysia
99.5
/100
|
#62
Exceptional
27.3%
Immigrants | Northern Europe
99.5
/100
|
#63
Exceptional
27.3%
Russians
99.5
/100
|
#64
Exceptional
27.3%
Immigrants | Turkey
99.5
/100
|
#65
Exceptional
27.3%
Soviet Union
99.5
/100
|
#66
Exceptional
27.3%
Immigrants | Australia
99.5
/100
|
#67
Exceptional
27.3%
Immigrants | Czechoslovakia
99.5
/100
|
#68
Exceptional
27.4%
Lithuanians
99.4
/100
|
#69
Exceptional
27.4%