Nonimmigrants vs Guyanese Single Mother Poverty

COMPARE

Nonimmigrants
Race
Ancestry
AfghanAfricanAlaska NativeAlaskan AthabascanAlbanianAleutAlsatianAmericanApacheArabArapahoArgentineanArmenianAssyrian/Chaldean/SyriacAustralianAustrianBahamianBangladeshiBarbadianBasqueBelgianBelizeanBermudanBhutaneseBlackfeetBolivianBrazilianBritishBritish West IndianBulgarianBurmeseCajunCambodianCanadianCape VerdeanCarpatho RusynCelticCentral AmericanCentral American IndianCherokeeCheyenneChickasawChileanChineseChippewaChoctawColombianColvilleComancheCosta RicanCreeCreekCroatianCrowCubanCypriotCzechCzechoslovakianDanishDelawareDominicanDutchDutch West IndianEastern EuropeanEcuadorianEgyptianEnglishEstonianEthiopianEuropeanFijianFilipinoFinnishFrenchFrench American IndianFrench CanadianGermanGerman RussianGhanaianGreekGuamanian/ChamorroGuatemalanHaitianHmongHonduranHopiHoumaHungarianIcelanderIndian (Asian)IndonesianInupiatIranianIraqiIrishIroquoisIsraeliItalianJamaicanJapaneseJordanianKenyanKiowaKoreanLaotianLatvianLebaneseLiberianLithuanianLumbeeLuxembourgerMacedonianMalaysianMalteseMarshalleseMenomineeMexicanMexican American IndianMongolianMoroccanNative HawaiianNavajoNepaleseNew ZealanderNicaraguanNigerianNorthern EuropeanNorwegianOkinawanOsageOttawaPaiutePakistaniPalestinianPanamanianParaguayanPennsylvania GermanPeruvianPimaPolishPortuguesePotawatomiPuebloPuerto RicanPuget Sound SalishRomanianRussianSalvadoranSamoanScandinavianScotch-IrishScottishSeminoleSenegaleseSerbianShoshoneSierra LeoneanSiouxSlavicSlovakSloveneSomaliSouth AfricanSouth AmericanSouth American IndianSoviet UnionSpaniardSpanishSpanish AmericanSpanish American IndianSri LankanSubsaharan AfricanSudaneseSwedishSwissSyrianTaiwaneseThaiTlingit-HaidaTohono O'OdhamTonganTrinidadian and TobagonianTsimshianTurkishU.S. Virgin IslanderUgandanUkrainianUruguayanUteVenezuelanVietnameseWelshWest IndianYakamaYaquiYugoslavianYumanYup'ikZimbabwean
Immigration
NonimmigrantsImmigrantsAfghanistanAfricaAlbaniaArgentinaArmeniaAsiaAustraliaAustriaBahamasBangladeshBarbadosBelarusBelgiumBelizeBoliviaBosnia and HerzegovinaBrazilBulgariaBurma/MyanmarCabo VerdeCambodiaCameroonCanadaCaribbeanCentral AmericaChileChinaColombiaCongoCosta RicaCroatiaCubaCzechoslovakiaDenmarkDominicaDominican RepublicEastern AfricaEastern AsiaEastern EuropeEcuadorEgyptEl SalvadorEnglandEritreaEthiopiaEuropeFijiFranceGermanyGhanaGreeceGrenadaGuatemalaGuyanaHaitiHondurasHong KongHungaryIndiaIndonesiaIranIraqIrelandIsraelItalyJamaicaJapanJordanKazakhstanKenyaKoreaKuwaitLaosLatin AmericaLatviaLebanonLiberiaLithuaniaMalaysiaMexicoMicronesiaMiddle AfricaMoldovaMoroccoNepalNetherlandsNicaraguaNigeriaNorth AmericaNorth MacedoniaNorthern AfricaNorthern EuropeNorwayOceaniaPakistanPanamaPeruPhilippinesPolandPortugalRomaniaRussiaSaudi ArabiaScotlandSenegalSerbiaSierra LeoneSingaporeSomaliaSouth AfricaSouth AmericaSouth Central AsiaSouth Eastern AsiaSouthern EuropeSpainSri LankaSt. Vincent and the GrenadinesSudanSwedenSwitzerlandSyriaTaiwanThailandTrinidad and TobagoTurkeyUgandaUkraineUruguayUzbekistanVenezuelaVietnamWest IndiesWestern AfricaWestern AsiaWestern EuropeYemenZaireZimbabweAzores
Guyanese
Race
Ancestry
AfghanAfricanAlaska NativeAlaskan AthabascanAlbanianAleutAlsatianAmericanApacheArabArapahoArgentineanArmenianAssyrian/Chaldean/SyriacAustralianAustrianBahamianBangladeshiBarbadianBasqueBelgianBelizeanBermudanBhutaneseBlackfeetBolivianBrazilianBritishBritish West IndianBulgarianBurmeseCajunCambodianCanadianCape VerdeanCarpatho RusynCelticCentral AmericanCentral American IndianCherokeeCheyenneChickasawChileanChineseChippewaChoctawColombianColvilleComancheCosta RicanCreeCreekCroatianCrowCubanCypriotCzechCzechoslovakianDanishDelawareDominicanDutchDutch West IndianEastern EuropeanEcuadorianEgyptianEnglishEstonianEthiopianEuropeanFijianFilipinoFinnishFrenchFrench American IndianFrench CanadianGermanGerman RussianGhanaianGreekGuamanian/ChamorroGuatemalanGuyaneseHaitianHmongHonduranHopiHoumaHungarianIcelanderIndian (Asian)IndonesianInupiatIranianIraqiIrishIroquoisIsraeliItalianJamaicanJapaneseJordanianKenyanKiowaKoreanLaotianLatvianLebaneseLiberianLithuanianLumbeeLuxembourgerMacedonianMalaysianMalteseMarshalleseMenomineeMexicanMexican American IndianMongolianMoroccanNative HawaiianNavajoNepaleseNew ZealanderNicaraguanNigerianNorthern EuropeanNorwegianOkinawanOsageOttawaPaiutePakistaniPalestinianPanamanianParaguayanPennsylvania GermanPeruvianPimaPolishPortuguesePotawatomiPuebloPuerto RicanPuget Sound SalishRomanianRussianSalvadoranSamoanScandinavianScotch-IrishScottishSeminoleSenegaleseSerbianShoshoneSierra LeoneanSiouxSlavicSlovakSloveneSomaliSouth AfricanSouth AmericanSouth American IndianSoviet UnionSpaniardSpanishSpanish AmericanSpanish American IndianSri LankanSubsaharan AfricanSudaneseSwedishSwissSyrianTaiwaneseThaiTlingit-HaidaTohono O'OdhamTonganTrinidadian and TobagonianTsimshianTurkishU.S. Virgin IslanderUgandanUkrainianUruguayanUteVenezuelanVietnameseWelshWest IndianYakamaYaquiYugoslavianYumanYup'ikZimbabwean
Immigration
ImmigrantsAfghanistanAfricaAlbaniaArgentinaArmeniaAsiaAustraliaAustriaBahamasBangladeshBarbadosBelarusBelgiumBelizeBoliviaBosnia and HerzegovinaBrazilBulgariaBurma/MyanmarCabo VerdeCambodiaCameroonCanadaCaribbeanCentral AmericaChileChinaColombiaCongoCosta RicaCroatiaCubaCzechoslovakiaDenmarkDominicaDominican RepublicEastern AfricaEastern AsiaEastern EuropeEcuadorEgyptEl SalvadorEnglandEritreaEthiopiaEuropeFijiFranceGermanyGhanaGreeceGrenadaGuatemalaGuyanaHaitiHondurasHong KongHungaryIndiaIndonesiaIranIraqIrelandIsraelItalyJamaicaJapanJordanKazakhstanKenyaKoreaKuwaitLaosLatin AmericaLatviaLebanonLiberiaLithuaniaMalaysiaMexicoMicronesiaMiddle AfricaMoldovaMoroccoNepalNetherlandsNicaraguaNigeriaNorth AmericaNorth MacedoniaNorthern AfricaNorthern EuropeNorwayOceaniaPakistanPanamaPeruPhilippinesPolandPortugalRomaniaRussiaSaudi ArabiaScotlandSenegalSerbiaSierra LeoneSingaporeSomaliaSouth AfricaSouth AmericaSouth Central AsiaSouth Eastern AsiaSouthern EuropeSpainSri LankaSt. Vincent and the GrenadinesSudanSwedenSwitzerlandSyriaTaiwanThailandTrinidad and TobagoTurkeyUgandaUkraineUruguayUzbekistanVenezuelaVietnamWest IndiesWestern AfricaWestern AsiaWestern EuropeYemenZaireZimbabweAzores
Single Mother Poverty
Income
Poverty
Unemployment
Labor Participation
Family Structure
Vehicle Availability
Education Level
Disability

Single Mother Poverty Comparison

Nonimmigrants

Guyanese

Tragic
Poor
32.2%
SINGLE MOTHER POVERTY
0.0/ 100
METRIC RATING
280th/ 347
METRIC RANK
29.8%
SINGLE MOTHER POVERTY
12.8/ 100
METRIC RATING
211th/ 347
METRIC RANK

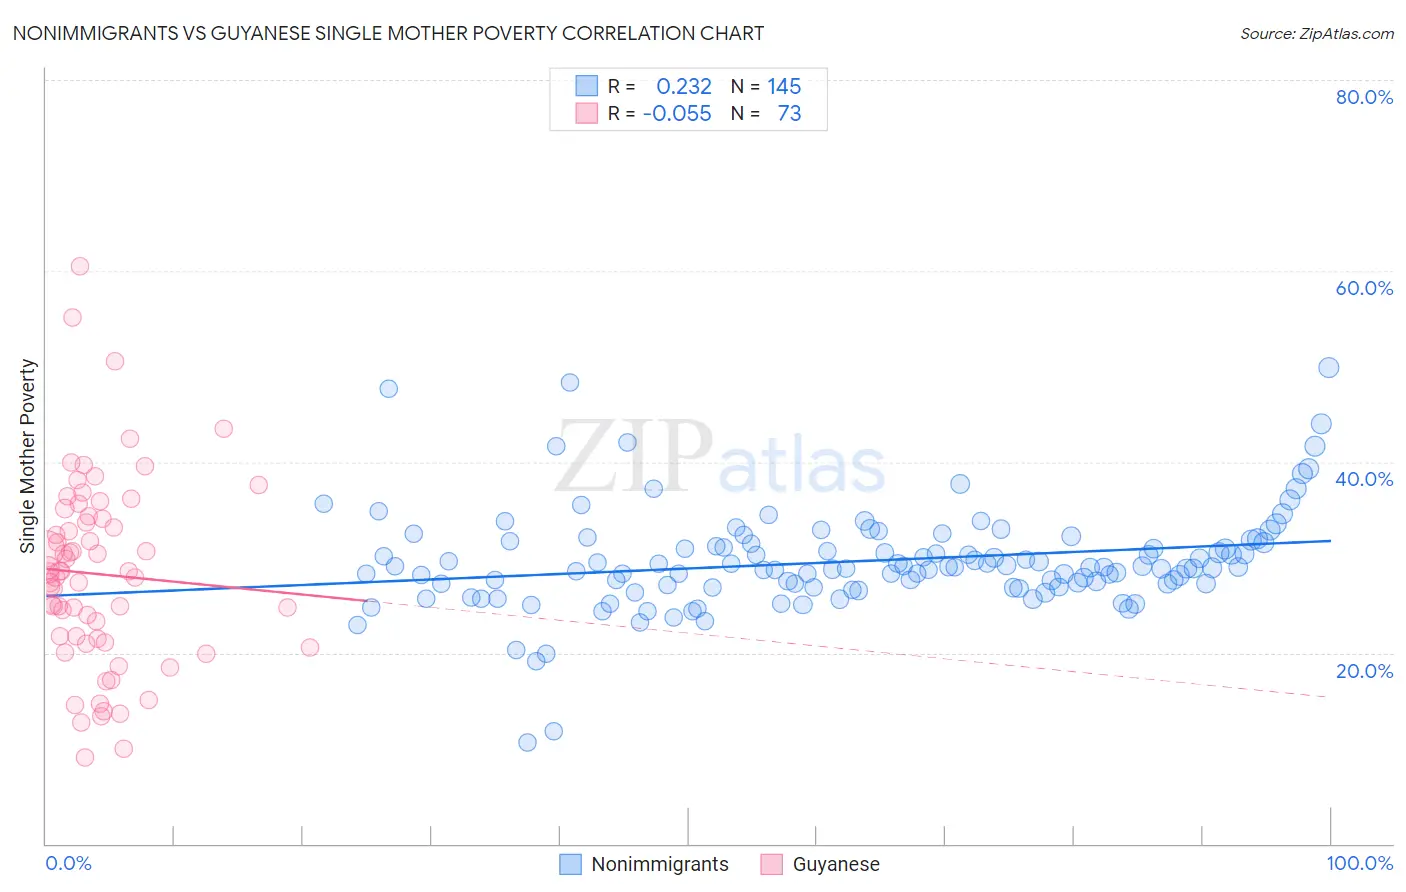
Nonimmigrants vs Guyanese Single Mother Poverty Correlation Chart

The statistical analysis conducted on geographies consisting of 553,388,851 people shows a weak positive correlation between the proportion of Nonimmigrants and poverty level among single mothers in the United States with a correlation coefficient (R) of 0.232 and weighted average of 32.2%. Similarly, the statistical analysis conducted on geographies consisting of 174,134,686 people shows a slight negative correlation between the proportion of Guyanese and poverty level among single mothers in the United States with a correlation coefficient (R) of -0.055 and weighted average of 29.8%, a difference of 7.8%.
Nonimmigrants vs Guyanese Single Mother Poverty

Single Mother Poverty Correlation Summary

MeasurementNonimmigrantsGuyanese
Minimum10.6%9.1%
Maximum49.9%60.5%
Range39.4%51.4%
Mean29.6%28.2%
Median29.0%28.4%
Interquartile 25% (IQ1)27.0%21.3%
Interquartile 75% (IQ3)31.7%34.2%
Interquartile Range (IQR)4.7%12.9%
Standard Deviation (Sample)5.4%9.9%
Standard Deviation (Population)5.4%9.9%

Similar Demographics by Single Mother Poverty

Demographics Similar to Nonimmigrants by Single Mother Poverty

In terms of single mother poverty, the demographic groups most similar to Nonimmigrants are Cree (32.2%, a difference of 0.030%), Immigrants from the Azores (32.2%, a difference of 0.14%), Marshallese (32.1%, a difference of 0.22%), Spanish American (32.3%, a difference of 0.39%), and Immigrants from Zaire (32.0%, a difference of 0.62%).
DemographicsRating | RankSingle Mother Poverty
Fijians
0.1
/100
|
#273
Tragic
31.6%
Bangladeshis
0.1
/100
|
#274
Tragic
31.7%
Central Americans
0.1
/100
|
#275
Tragic
31.8%
Delaware
0.0
/100
|
#276
Tragic
31.8%
Mexican American Indians
0.0
/100
|
#277
Tragic
31.9%
Immigrants | Zaire
0.0
/100
|
#278
Tragic
32.0%
Marshallese
0.0
/100
|
#279
Tragic
32.1%
Immigrants | Nonimmigrants
0.0
/100
|
#280
Tragic
32.2%
Cree
0.0
/100
|
#281
Tragic
32.2%
Immigrants | Azores
0.0
/100
|
#282
Tragic
32.2%
Spanish Americans
0.0
/100
|
#283
Tragic
32.3%
Indonesians
0.0
/100
|
#284
Tragic
32.4%
Immigrants | Latin America
0.0
/100
|
#285
Tragic
32.4%
Yup'ik
0.0
/100
|
#286
Tragic
32.5%
Immigrants | Dominica
0.0
/100
|
#287
Tragic
32.5%

Demographics Similar to Guyanese by Single Mother Poverty

In terms of single mother poverty, the demographic groups most similar to Guyanese are Nicaraguan (29.8%, a difference of 0.040%), Haitian (29.8%, a difference of 0.050%), Immigrants from Thailand (29.9%, a difference of 0.090%), Irish (29.8%, a difference of 0.11%), and Liberian (29.9%, a difference of 0.12%).
DemographicsRating | RankSingle Mother Poverty
Immigrants | Immigrants
16.6
/100
|
#204
Poor
29.7%
Czechoslovakians
16.1
/100
|
#205
Poor
29.7%
Immigrants | Haiti
15.8
/100
|
#206
Poor
29.7%
Immigrants | Panama
15.5
/100
|
#207
Poor
29.8%
Immigrants | Guyana
14.7
/100
|
#208
Poor
29.8%
Irish
13.9
/100
|
#209
Poor
29.8%
Haitians
13.3
/100
|
#210
Poor
29.8%
Guyanese
12.8
/100
|
#211
Poor
29.8%
Nicaraguans
12.4
/100
|
#212
Poor
29.8%
Immigrants | Thailand
12.0
/100
|
#213
Poor
29.9%
Liberians
11.7
/100
|
#214
Poor
29.9%
Jamaicans
11.7
/100
|
#215
Poor
29.9%
Immigrants | Western Africa
11.5
/100
|
#216
Poor
29.9%
Immigrants | Ghana
11.3
/100
|
#217
Poor
29.9%
Hungarians
10.3
/100
|
#218
Poor
29.9%