Nigerian vs Subsaharan African Seniors Poverty Over the Age of 75
COMPARE
Nigerian
Subsaharan African
Seniors Poverty Over the Age of 75
Seniors Poverty Over the Age of 75 Comparison
Nigerians
Sub-Saharan Africans
13.0%
SENIORS POVERTY OVER THE AGE OF 75
3.4/ 100
METRIC RATING
222nd/ 347
METRIC RANK
13.2%
SENIORS POVERTY OVER THE AGE OF 75
1.5/ 100
METRIC RATING
231st/ 347
METRIC RANK
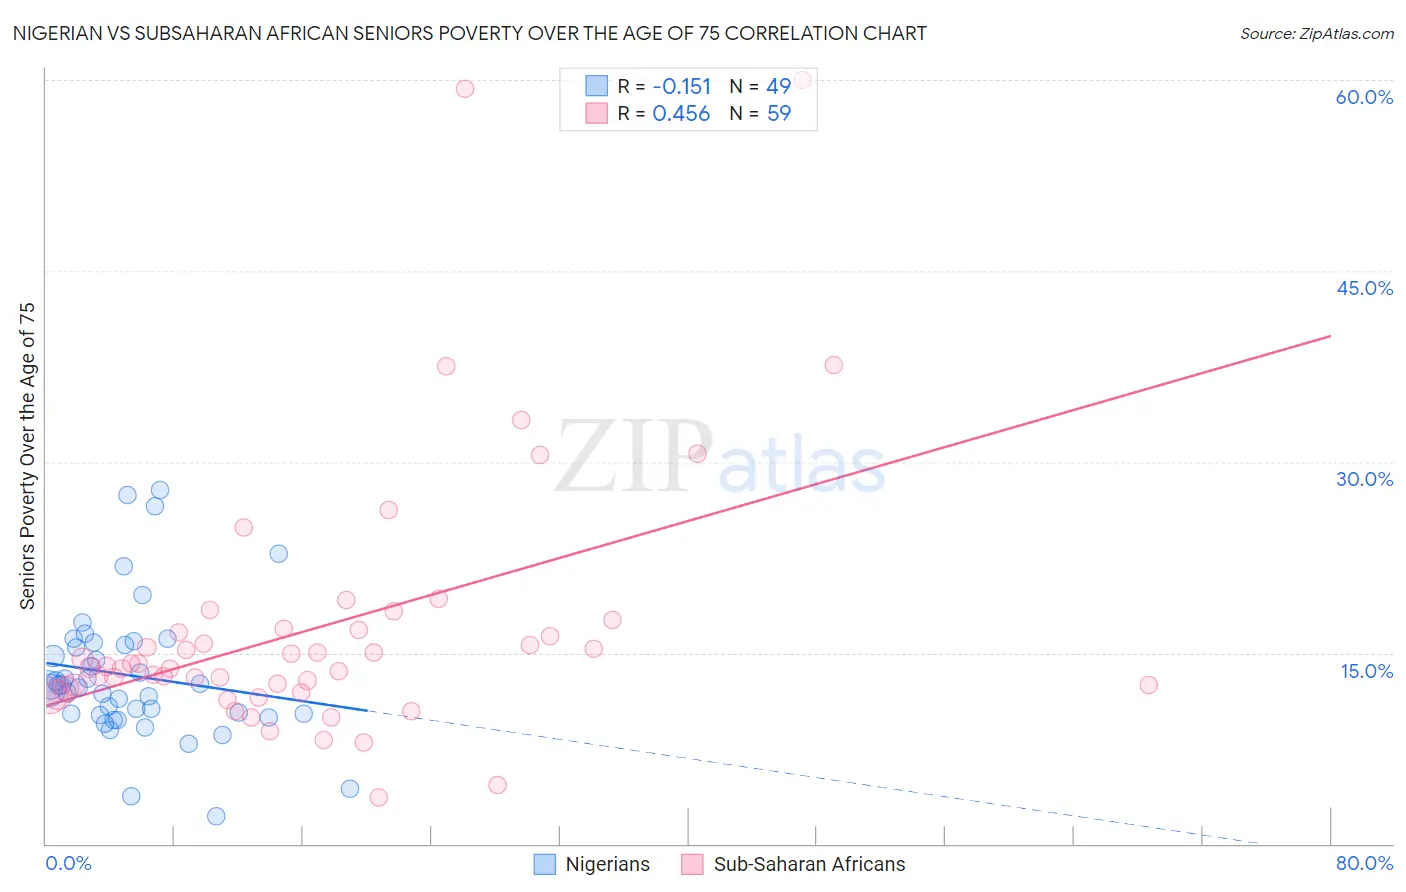
Nigerian vs Subsaharan African Seniors Poverty Over the Age of 75 Correlation Chart
The statistical analysis conducted on geographies consisting of 329,712,817 people shows a poor negative correlation between the proportion of Nigerians and poverty level among seniors over the age of 75 in the United States with a correlation coefficient (R) of -0.151 and weighted average of 13.0%. Similarly, the statistical analysis conducted on geographies consisting of 499,481,078 people shows a moderate positive correlation between the proportion of Sub-Saharan Africans and poverty level among seniors over the age of 75 in the United States with a correlation coefficient (R) of 0.456 and weighted average of 13.2%, a difference of 1.6%.
Seniors Poverty Over the Age of 75 Correlation Summary
| Measurement | Nigerian | Subsaharan African |
| Minimum | 2.2% | 3.6% |
| Maximum | 27.8% | 60.0% |
| Range | 25.6% | 56.4% |
| Mean | 13.2% | 17.1% |
| Median | 12.3% | 13.9% |
| Interquartile 25% (IQ1) | 10.2% | 12.2% |
| Interquartile 75% (IQ3) | 15.7% | 16.9% |
| Interquartile Range (IQR) | 5.5% | 4.7% |
| Standard Deviation (Sample) | 5.3% | 10.6% |
| Standard Deviation (Population) | 5.3% | 10.5% |
Demographics Similar to Nigerians and Sub-Saharan Africans by Seniors Poverty Over the Age of 75
In terms of seniors poverty over the age of 75, the demographic groups most similar to Nigerians are Immigrants from Nigeria (13.0%, a difference of 0.090%), Chippewa (13.1%, a difference of 0.29%), Immigrants from Morocco (13.1%, a difference of 0.36%), Immigrants from Kazakhstan (13.0%, a difference of 0.44%), and Shoshone (13.1%, a difference of 0.52%). Similarly, the demographic groups most similar to Sub-Saharan Africans are Immigrants from China (13.2%, a difference of 0.010%), Somali (13.2%, a difference of 0.090%), Immigrants from Chile (13.3%, a difference of 0.20%), Immigrants from Costa Rica (13.3%, a difference of 0.23%), and Israeli (13.2%, a difference of 0.53%).
| Demographics | Rating | Rank | Seniors Poverty Over the Age of 75 |
| Immigrants | Brazil | 5.2 /100 | #216 | Tragic 12.9% |
| Bermudans | 4.9 /100 | #217 | Tragic 12.9% |
| Immigrants | Western Asia | 4.9 /100 | #218 | Tragic 12.9% |
| Ute | 4.7 /100 | #219 | Tragic 12.9% |
| Seminole | 4.5 /100 | #220 | Tragic 12.9% |
| Immigrants | Kazakhstan | 4.3 /100 | #221 | Tragic 13.0% |
| Nigerians | 3.4 /100 | #222 | Tragic 13.0% |
| Immigrants | Nigeria | 3.3 /100 | #223 | Tragic 13.0% |
| Chippewa | 2.9 /100 | #224 | Tragic 13.1% |
| Immigrants | Morocco | 2.8 /100 | #225 | Tragic 13.1% |
| Shoshone | 2.6 /100 | #226 | Tragic 13.1% |
| Cree | 2.3 /100 | #227 | Tragic 13.1% |
| Israelis | 2.0 /100 | #228 | Tragic 13.2% |
| Somalis | 1.6 /100 | #229 | Tragic 13.2% |
| Immigrants | China | 1.5 /100 | #230 | Tragic 13.2% |
| Sub-Saharan Africans | 1.5 /100 | #231 | Tragic 13.2% |
| Immigrants | Chile | 1.3 /100 | #232 | Tragic 13.3% |
| Immigrants | Costa Rica | 1.3 /100 | #233 | Tragic 13.3% |
| Immigrants | Israel | 1.1 /100 | #234 | Tragic 13.3% |
| Japanese | 0.9 /100 | #235 | Tragic 13.3% |
| Moroccans | 0.9 /100 | #236 | Tragic 13.3% |