Nicaraguan vs Immigrants from Colombia Poverty

COMPARE

Nicaraguan
Race
Ancestry
AfghanAfricanAlaska NativeAlaskan AthabascanAlbanianAleutAlsatianAmericanApacheArabArapahoArgentineanArmenianAssyrian/Chaldean/SyriacAustralianAustrianBahamianBangladeshiBarbadianBasqueBelgianBelizeanBermudanBhutaneseBlackfeetBolivianBrazilianBritishBritish West IndianBulgarianBurmeseCajunCambodianCanadianCape VerdeanCarpatho RusynCelticCentral AmericanCentral American IndianCherokeeCheyenneChickasawChileanChineseChippewaChoctawColombianColvilleComancheCosta RicanCreeCreekCroatianCrowCubanCypriotCzechCzechoslovakianDanishDelawareDominicanDutchDutch West IndianEastern EuropeanEcuadorianEgyptianEnglishEstonianEthiopianEuropeanFijianFilipinoFinnishFrenchFrench American IndianFrench CanadianGermanGerman RussianGhanaianGreekGuamanian/ChamorroGuatemalanGuyaneseHaitianHmongHonduranHopiHoumaHungarianIcelanderIndian (Asian)IndonesianInupiatIranianIraqiIrishIroquoisIsraeliItalianJamaicanJapaneseJordanianKenyanKiowaKoreanLaotianLatvianLebaneseLiberianLithuanianLumbeeLuxembourgerMacedonianMalaysianMalteseMarshalleseMenomineeMexicanMexican American IndianMongolianMoroccanNative HawaiianNavajoNepaleseNew ZealanderNicaraguanNigerianNorthern EuropeanNorwegianOkinawanOsageOttawaPaiutePakistaniPalestinianPanamanianParaguayanPennsylvania GermanPeruvianPimaPolishPortuguesePotawatomiPuebloPuerto RicanPuget Sound SalishRomanianRussianSalvadoranSamoanScandinavianScotch-IrishScottishSeminoleSenegaleseSerbianShoshoneSierra LeoneanSiouxSlavicSlovakSloveneSomaliSouth AfricanSouth AmericanSouth American IndianSoviet UnionSpaniardSpanishSpanish AmericanSpanish American IndianSri LankanSubsaharan AfricanSudaneseSwedishSwissSyrianTaiwaneseThaiTlingit-HaidaTohono O'OdhamTonganTrinidadian and TobagonianTsimshianTurkishU.S. Virgin IslanderUgandanUkrainianUruguayanUteVenezuelanVietnameseWelshWest IndianYakamaYaquiYugoslavianYumanYup'ikZimbabwean
Immigration
NonimmigrantsImmigrantsAfghanistanAfricaAlbaniaArgentinaArmeniaAsiaAustraliaAustriaBahamasBangladeshBarbadosBelarusBelgiumBelizeBoliviaBosnia and HerzegovinaBrazilBulgariaBurma/MyanmarCabo VerdeCambodiaCameroonCanadaCaribbeanCentral AmericaChileChinaCongoCosta RicaCroatiaCubaCzechoslovakiaDenmarkDominicaDominican RepublicEastern AfricaEastern AsiaEastern EuropeEcuadorEgyptEl SalvadorEnglandEritreaEthiopiaEuropeFijiFranceGermanyGhanaGreeceGrenadaGuatemalaGuyanaHaitiHondurasHong KongHungaryIndiaIndonesiaIranIraqIrelandIsraelItalyJamaicaJapanJordanKazakhstanKenyaKoreaKuwaitLaosLatin AmericaLatviaLebanonLiberiaLithuaniaMalaysiaMexicoMicronesiaMiddle AfricaMoldovaMoroccoNepalNetherlandsNicaraguaNigeriaNorth AmericaNorth MacedoniaNorthern AfricaNorthern EuropeNorwayOceaniaPakistanPanamaPeruPhilippinesPolandPortugalRomaniaRussiaSaudi ArabiaScotlandSenegalSerbiaSierra LeoneSingaporeSomaliaSouth AfricaSouth AmericaSouth Central AsiaSouth Eastern AsiaSouthern EuropeSpainSri LankaSt. Vincent and the GrenadinesSudanSwedenSwitzerlandSyriaTaiwanThailandTrinidad and TobagoTurkeyUgandaUkraineUruguayUzbekistanVenezuelaVietnamWest IndiesWestern AfricaWestern AsiaWestern EuropeYemenZaireZimbabweAzores
Immigrants from Colombia
Race
Ancestry
AfghanAfricanAlaska NativeAlaskan AthabascanAlbanianAleutAlsatianAmericanApacheArabArapahoArgentineanArmenianAssyrian/Chaldean/SyriacAustralianAustrianBahamianBangladeshiBarbadianBasqueBelgianBelizeanBermudanBhutaneseBlackfeetBolivianBrazilianBritishBritish West IndianBulgarianBurmeseCajunCambodianCanadianCape VerdeanCarpatho RusynCelticCentral AmericanCentral American IndianCherokeeCheyenneChickasawChileanChineseChippewaChoctawColombianColvilleComancheCosta RicanCreeCreekCroatianCrowCubanCypriotCzechCzechoslovakianDanishDelawareDominicanDutchDutch West IndianEastern EuropeanEcuadorianEgyptianEnglishEstonianEthiopianEuropeanFijianFilipinoFinnishFrenchFrench American IndianFrench CanadianGermanGerman RussianGhanaianGreekGuamanian/ChamorroGuatemalanGuyaneseHaitianHmongHonduranHopiHoumaHungarianIcelanderIndian (Asian)IndonesianInupiatIranianIraqiIrishIroquoisIsraeliItalianJamaicanJapaneseJordanianKenyanKiowaKoreanLaotianLatvianLebaneseLiberianLithuanianLumbeeLuxembourgerMacedonianMalaysianMalteseMarshalleseMenomineeMexicanMexican American IndianMongolianMoroccanNative HawaiianNavajoNepaleseNew ZealanderNigerianNorthern EuropeanNorwegianOkinawanOsageOttawaPaiutePakistaniPalestinianPanamanianParaguayanPennsylvania GermanPeruvianPimaPolishPortuguesePotawatomiPuebloPuerto RicanPuget Sound SalishRomanianRussianSalvadoranSamoanScandinavianScotch-IrishScottishSeminoleSenegaleseSerbianShoshoneSierra LeoneanSiouxSlavicSlovakSloveneSomaliSouth AfricanSouth AmericanSouth American IndianSoviet UnionSpaniardSpanishSpanish AmericanSpanish American IndianSri LankanSubsaharan AfricanSudaneseSwedishSwissSyrianTaiwaneseThaiTlingit-HaidaTohono O'OdhamTonganTrinidadian and TobagonianTsimshianTurkishU.S. Virgin IslanderUgandanUkrainianUruguayanUteVenezuelanVietnameseWelshWest IndianYakamaYaquiYugoslavianYumanYup'ikZimbabwean
Immigration
NonimmigrantsImmigrantsAfghanistanAfricaAlbaniaArgentinaArmeniaAsiaAustraliaAustriaBahamasBangladeshBarbadosBelarusBelgiumBelizeBoliviaBosnia and HerzegovinaBrazilBulgariaBurma/MyanmarCabo VerdeCambodiaCameroonCanadaCaribbeanCentral AmericaChileChinaColombiaCongoCosta RicaCroatiaCubaCzechoslovakiaDenmarkDominicaDominican RepublicEastern AfricaEastern AsiaEastern EuropeEcuadorEgyptEl SalvadorEnglandEritreaEthiopiaEuropeFijiFranceGermanyGhanaGreeceGrenadaGuatemalaGuyanaHaitiHondurasHong KongHungaryIndiaIndonesiaIranIraqIrelandIsraelItalyJamaicaJapanJordanKazakhstanKenyaKoreaKuwaitLaosLatin AmericaLatviaLebanonLiberiaLithuaniaMalaysiaMexicoMicronesiaMiddle AfricaMoldovaMoroccoNepalNetherlandsNicaraguaNigeriaNorth AmericaNorth MacedoniaNorthern AfricaNorthern EuropeNorwayOceaniaPakistanPanamaPeruPhilippinesPolandPortugalRomaniaRussiaSaudi ArabiaScotlandSenegalSerbiaSierra LeoneSingaporeSomaliaSouth AfricaSouth AmericaSouth Central AsiaSouth Eastern AsiaSouthern EuropeSpainSri LankaSt. Vincent and the GrenadinesSudanSwedenSwitzerlandSyriaTaiwanThailandTrinidad and TobagoTurkeyUgandaUkraineUruguayUzbekistanVenezuelaVietnamWest IndiesWestern AfricaWestern AsiaWestern EuropeYemenZaireZimbabweAzores
Poverty
Income
Poverty
Unemployment
Labor Participation
Family Structure
Vehicle Availability
Education Level
Disability

Poverty Comparison

Nicaraguans

Immigrants from Colombia

Tragic
Average
13.9%
POVERTY
0.4/ 100
METRIC RATING
239th/ 347
METRIC RANK
12.3%
POVERTY
47.7/ 100
METRIC RATING
176th/ 347
METRIC RANK

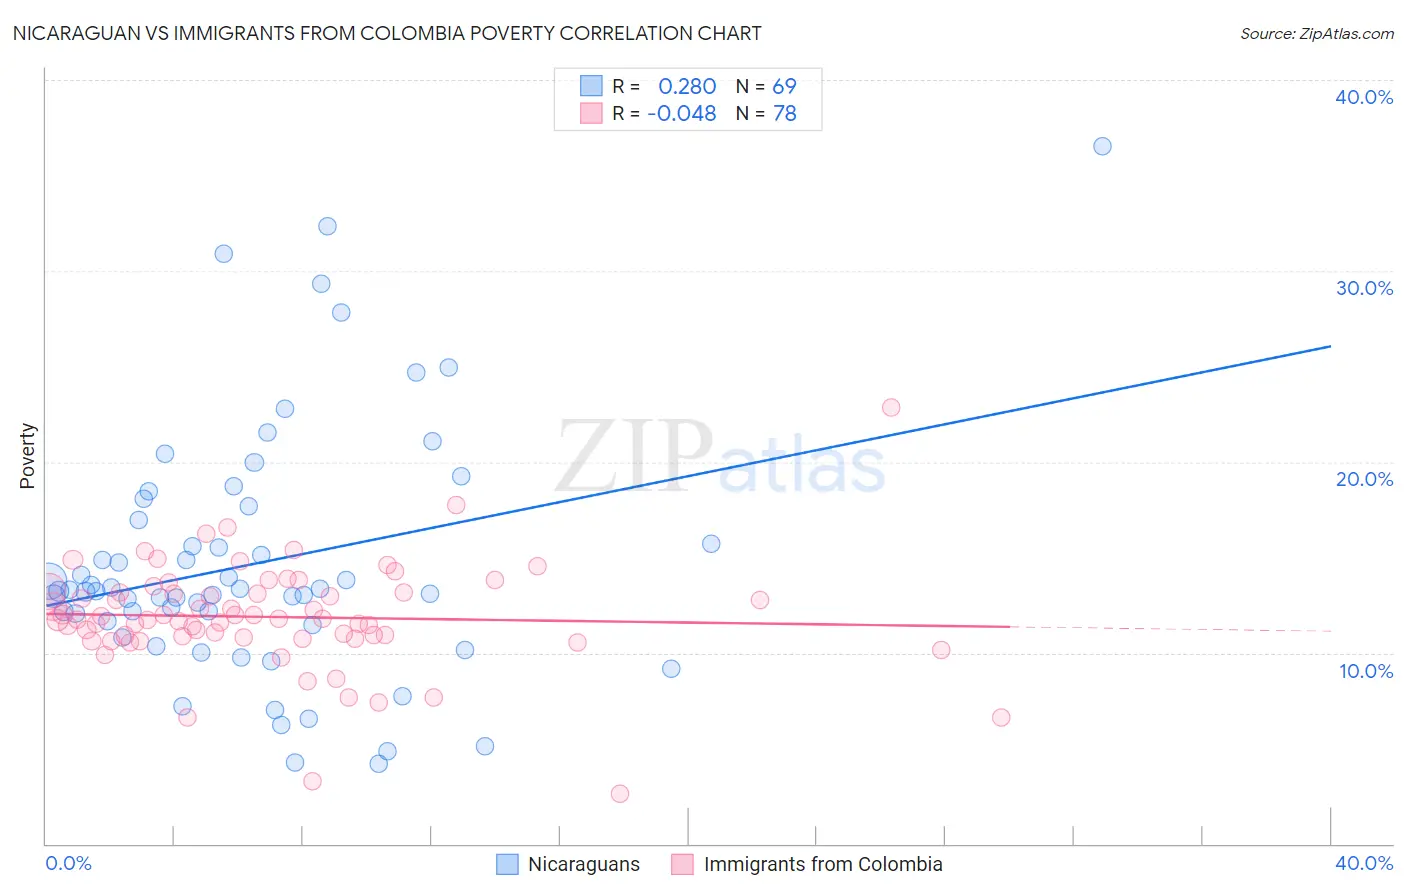
Nicaraguan vs Immigrants from Colombia Poverty Correlation Chart

The statistical analysis conducted on geographies consisting of 285,615,173 people shows a weak positive correlation between the proportion of Nicaraguans and poverty level in the United States with a correlation coefficient (R) of 0.280 and weighted average of 13.9%. Similarly, the statistical analysis conducted on geographies consisting of 378,485,502 people shows no correlation between the proportion of Immigrants from Colombia and poverty level in the United States with a correlation coefficient (R) of -0.048 and weighted average of 12.3%, a difference of 12.9%.
Nicaraguan vs Immigrants from Colombia Poverty

Poverty Correlation Summary

MeasurementNicaraguanImmigrants from Colombia
Minimum4.2%2.6%
Maximum36.5%22.8%
Range32.4%20.2%
Mean14.7%11.9%
Median13.2%11.8%
Interquartile 25% (IQ1)11.5%10.8%
Interquartile 75% (IQ3)17.3%13.2%
Interquartile Range (IQR)5.8%2.3%
Standard Deviation (Sample)6.5%2.8%
Standard Deviation (Population)6.5%2.8%

Similar Demographics by Poverty

Demographics Similar to Nicaraguans by Poverty

In terms of poverty, the demographic groups most similar to Nicaraguans are Immigrants from Middle Africa (14.0%, a difference of 0.12%), Salvadoran (14.0%, a difference of 0.14%), Ghanaian (13.9%, a difference of 0.35%), Ecuadorian (14.0%, a difference of 0.46%), and French American Indian (13.9%, a difference of 0.48%).
DemographicsRating | RankPoverty
Fijians
0.8
/100
|
#232
Tragic
13.7%
Immigrants | Saudi Arabia
0.8
/100
|
#233
Tragic
13.8%
Immigrants | Laos
0.7
/100
|
#234
Tragic
13.8%
Cubans
0.6
/100
|
#235
Tragic
13.9%
Immigrants | Armenia
0.5
/100
|
#236
Tragic
13.9%
French American Indians
0.5
/100
|
#237
Tragic
13.9%
Ghanaians
0.5
/100
|
#238
Tragic
13.9%
Nicaraguans
0.4
/100
|
#239
Tragic
13.9%
Immigrants | Middle Africa
0.4
/100
|
#240
Tragic
14.0%
Salvadorans
0.4
/100
|
#241
Tragic
14.0%
Ecuadorians
0.4
/100
|
#242
Tragic
14.0%
Sudanese
0.3
/100
|
#243
Tragic
14.0%
Nepalese
0.3
/100
|
#244
Tragic
14.0%
Immigrants | Sudan
0.3
/100
|
#245
Tragic
14.1%
Potawatomi
0.3
/100
|
#246
Tragic
14.1%

Demographics Similar to Immigrants from Colombia by Poverty

In terms of poverty, the demographic groups most similar to Immigrants from Colombia are Immigrants from Syria (12.3%, a difference of 0.020%), South American (12.3%, a difference of 0.090%), Lebanese (12.3%, a difference of 0.23%), Celtic (12.3%, a difference of 0.24%), and Immigrants from Portugal (12.3%, a difference of 0.28%).
DemographicsRating | RankPoverty
Whites/Caucasians
55.4
/100
|
#169
Average
12.3%
Immigrants | Oceania
54.6
/100
|
#170
Average
12.3%
Immigrants | Spain
51.3
/100
|
#171
Average
12.3%
Immigrants | Portugal
50.5
/100
|
#172
Average
12.3%
Celtics
50.1
/100
|
#173
Average
12.3%
Lebanese
50.0
/100
|
#174
Average
12.3%
South Americans
48.7
/100
|
#175
Average
12.3%
Immigrants | Colombia
47.7
/100
|
#176
Average
12.3%
Immigrants | Syria
47.5
/100
|
#177
Average
12.3%
Uruguayans
44.7
/100
|
#178
Average
12.4%
Immigrants | Morocco
44.0
/100
|
#179
Average
12.4%
Mongolians
43.6
/100
|
#180
Average
12.4%
Immigrants | Afghanistan
42.1
/100
|
#181
Average
12.4%
Immigrants | Cameroon
41.7
/100
|
#182
Average
12.4%
Immigrants | Iraq
40.2
/100
|
#183
Average
12.4%