Nepalese vs Maltese Poverty

COMPARE

Nepalese
Race
Ancestry
AfghanAfricanAlaska NativeAlaskan AthabascanAlbanianAleutAlsatianAmericanApacheArabArapahoArgentineanArmenianAssyrian/Chaldean/SyriacAustralianAustrianBahamianBangladeshiBarbadianBasqueBelgianBelizeanBermudanBhutaneseBlackfeetBolivianBrazilianBritishBritish West IndianBulgarianBurmeseCajunCambodianCanadianCape VerdeanCarpatho RusynCelticCentral AmericanCentral American IndianCherokeeCheyenneChickasawChileanChineseChippewaChoctawColombianColvilleComancheCosta RicanCreeCreekCroatianCrowCubanCypriotCzechCzechoslovakianDanishDelawareDominicanDutchDutch West IndianEastern EuropeanEcuadorianEgyptianEnglishEstonianEthiopianEuropeanFijianFilipinoFinnishFrenchFrench American IndianFrench CanadianGermanGerman RussianGhanaianGreekGuamanian/ChamorroGuatemalanGuyaneseHaitianHmongHonduranHopiHoumaHungarianIcelanderIndian (Asian)IndonesianInupiatIranianIraqiIrishIroquoisIsraeliItalianJamaicanJapaneseJordanianKenyanKiowaKoreanLaotianLatvianLebaneseLiberianLithuanianLumbeeLuxembourgerMacedonianMalaysianMarshalleseMenomineeMexicanMexican American IndianMongolianMoroccanNative HawaiianNavajoNepaleseNew ZealanderNicaraguanNigerianNorthern EuropeanNorwegianOkinawanOsageOttawaPaiutePakistaniPalestinianPanamanianParaguayanPennsylvania GermanPeruvianPimaPolishPortuguesePotawatomiPuebloPuerto RicanPuget Sound SalishRomanianRussianSalvadoranSamoanScandinavianScotch-IrishScottishSeminoleSenegaleseSerbianShoshoneSierra LeoneanSiouxSlavicSlovakSloveneSomaliSouth AfricanSouth AmericanSouth American IndianSoviet UnionSpaniardSpanishSpanish AmericanSpanish American IndianSri LankanSubsaharan AfricanSudaneseSwedishSwissSyrianTaiwaneseThaiTlingit-HaidaTohono O'OdhamTonganTrinidadian and TobagonianTsimshianTurkishU.S. Virgin IslanderUgandanUkrainianUruguayanUteVenezuelanVietnameseWelshWest IndianYakamaYaquiYugoslavianYumanYup'ikZimbabwean
Immigration
NonimmigrantsImmigrantsAfghanistanAfricaAlbaniaArgentinaArmeniaAsiaAustraliaAustriaBahamasBangladeshBarbadosBelarusBelgiumBelizeBoliviaBosnia and HerzegovinaBrazilBulgariaBurma/MyanmarCabo VerdeCambodiaCameroonCanadaCaribbeanCentral AmericaChileChinaColombiaCongoCosta RicaCroatiaCubaCzechoslovakiaDenmarkDominicaDominican RepublicEastern AfricaEastern AsiaEastern EuropeEcuadorEgyptEl SalvadorEnglandEritreaEthiopiaEuropeFijiFranceGermanyGhanaGreeceGrenadaGuatemalaGuyanaHaitiHondurasHong KongHungaryIndiaIndonesiaIranIraqIrelandIsraelItalyJamaicaJapanJordanKazakhstanKenyaKoreaKuwaitLaosLatin AmericaLatviaLebanonLiberiaLithuaniaMalaysiaMexicoMicronesiaMiddle AfricaMoldovaMoroccoNepalNetherlandsNicaraguaNigeriaNorth AmericaNorth MacedoniaNorthern AfricaNorthern EuropeNorwayOceaniaPakistanPanamaPeruPhilippinesPolandPortugalRomaniaRussiaSaudi ArabiaScotlandSenegalSerbiaSierra LeoneSingaporeSomaliaSouth AfricaSouth AmericaSouth Central AsiaSouth Eastern AsiaSouthern EuropeSpainSri LankaSt. Vincent and the GrenadinesSudanSwedenSwitzerlandSyriaTaiwanThailandTrinidad and TobagoTurkeyUgandaUkraineUruguayUzbekistanVenezuelaVietnamWest IndiesWestern AfricaWestern AsiaWestern EuropeYemenZaireZimbabweAzores
Maltese
Race
Ancestry
AfghanAfricanAlaska NativeAlaskan AthabascanAlbanianAleutAlsatianAmericanApacheArabArapahoArgentineanArmenianAssyrian/Chaldean/SyriacAustralianAustrianBahamianBangladeshiBarbadianBasqueBelgianBelizeanBermudanBhutaneseBlackfeetBolivianBrazilianBritishBritish West IndianBulgarianBurmeseCajunCambodianCanadianCape VerdeanCarpatho RusynCelticCentral AmericanCentral American IndianCherokeeCheyenneChickasawChileanChineseChippewaChoctawColombianColvilleComancheCosta RicanCreeCreekCroatianCrowCubanCypriotCzechCzechoslovakianDanishDelawareDominicanDutchDutch West IndianEastern EuropeanEcuadorianEgyptianEnglishEstonianEthiopianEuropeanFijianFilipinoFinnishFrenchFrench American IndianFrench CanadianGermanGerman RussianGhanaianGreekGuamanian/ChamorroGuatemalanGuyaneseHaitianHmongHonduranHopiHoumaHungarianIcelanderIndian (Asian)IndonesianInupiatIranianIraqiIrishIroquoisIsraeliItalianJamaicanJapaneseJordanianKenyanKiowaKoreanLaotianLatvianLebaneseLiberianLithuanianLumbeeLuxembourgerMacedonianMalaysianMalteseMarshalleseMenomineeMexicanMexican American IndianMongolianMoroccanNative HawaiianNavajoNew ZealanderNicaraguanNigerianNorthern EuropeanNorwegianOkinawanOsageOttawaPaiutePakistaniPalestinianPanamanianParaguayanPennsylvania GermanPeruvianPimaPolishPortuguesePotawatomiPuebloPuerto RicanPuget Sound SalishRomanianRussianSalvadoranSamoanScandinavianScotch-IrishScottishSeminoleSenegaleseSerbianShoshoneSierra LeoneanSiouxSlavicSlovakSloveneSomaliSouth AfricanSouth AmericanSouth American IndianSoviet UnionSpaniardSpanishSpanish AmericanSpanish American IndianSri LankanSubsaharan AfricanSudaneseSwedishSwissSyrianTaiwaneseThaiTlingit-HaidaTohono O'OdhamTonganTrinidadian and TobagonianTsimshianTurkishU.S. Virgin IslanderUgandanUkrainianUruguayanUteVenezuelanVietnameseWelshWest IndianYakamaYaquiYugoslavianYumanYup'ikZimbabwean
Immigration
NonimmigrantsImmigrantsAfghanistanAfricaAlbaniaArgentinaArmeniaAsiaAustraliaAustriaBahamasBangladeshBarbadosBelarusBelgiumBelizeBoliviaBosnia and HerzegovinaBrazilBulgariaBurma/MyanmarCabo VerdeCambodiaCameroonCanadaCaribbeanCentral AmericaChileChinaColombiaCongoCosta RicaCroatiaCubaCzechoslovakiaDenmarkDominicaDominican RepublicEastern AfricaEastern AsiaEastern EuropeEcuadorEgyptEl SalvadorEnglandEritreaEthiopiaEuropeFijiFranceGermanyGhanaGreeceGrenadaGuatemalaGuyanaHaitiHondurasHong KongHungaryIndiaIndonesiaIranIraqIrelandIsraelItalyJamaicaJapanJordanKazakhstanKenyaKoreaKuwaitLaosLatin AmericaLatviaLebanonLiberiaLithuaniaMalaysiaMexicoMicronesiaMiddle AfricaMoldovaMoroccoNepalNetherlandsNicaraguaNigeriaNorth AmericaNorth MacedoniaNorthern AfricaNorthern EuropeNorwayOceaniaPakistanPanamaPeruPhilippinesPolandPortugalRomaniaRussiaSaudi ArabiaScotlandSenegalSerbiaSierra LeoneSingaporeSomaliaSouth AfricaSouth AmericaSouth Central AsiaSouth Eastern AsiaSouthern EuropeSpainSri LankaSt. Vincent and the GrenadinesSudanSwedenSwitzerlandSyriaTaiwanThailandTrinidad and TobagoTurkeyUgandaUkraineUruguayUzbekistanVenezuelaVietnamWest IndiesWestern AfricaWestern AsiaWestern EuropeYemenZaireZimbabweAzores
Poverty
Income
Poverty
Unemployment
Labor Participation
Family Structure
Vehicle Availability
Education Level
Disability

Poverty Comparison

Nepalese

Maltese

Tragic
Exceptional
14.0%
POVERTY
0.3/ 100
METRIC RATING
244th/ 347
METRIC RANK
10.2%
POVERTY
99.9/ 100
METRIC RATING
8th/ 347
METRIC RANK

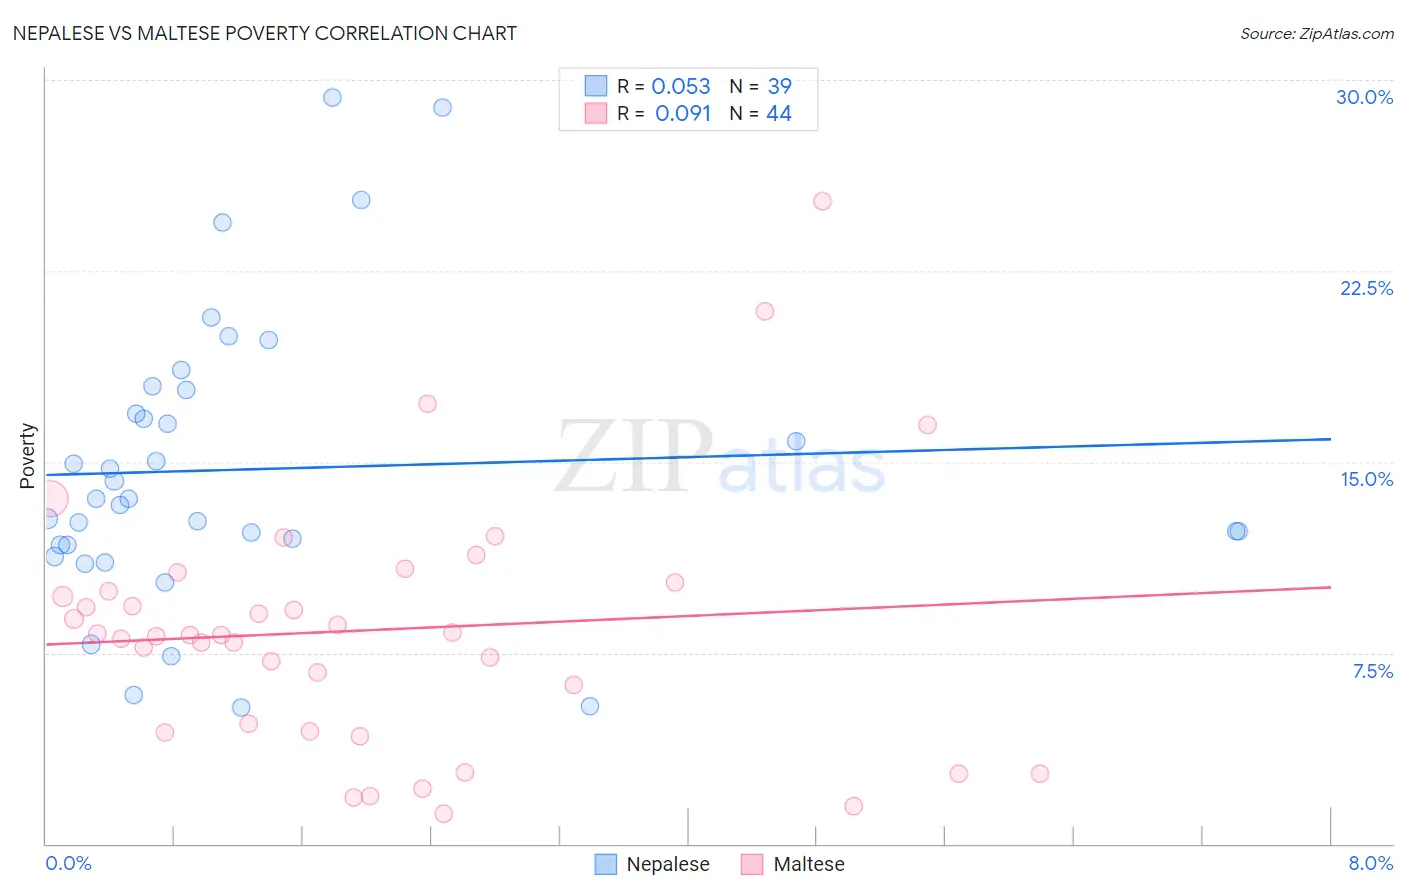
Nepalese vs Maltese Poverty Correlation Chart

The statistical analysis conducted on geographies consisting of 24,519,269 people shows a slight positive correlation between the proportion of Nepalese and poverty level in the United States with a correlation coefficient (R) of 0.053 and weighted average of 14.0%. Similarly, the statistical analysis conducted on geographies consisting of 126,440,716 people shows a slight positive correlation between the proportion of Maltese and poverty level in the United States with a correlation coefficient (R) of 0.091 and weighted average of 10.2%, a difference of 38.0%.
Nepalese vs Maltese Poverty

Poverty Correlation Summary

MeasurementNepaleseMaltese
Minimum5.4%1.2%
Maximum29.3%25.2%
Range23.9%24.1%
Mean14.7%8.4%
Median13.6%8.2%
Interquartile 25% (IQ1)11.7%4.6%
Interquartile 75% (IQ3)17.8%10.1%
Interquartile Range (IQR)6.1%5.5%
Standard Deviation (Sample)5.7%5.0%
Standard Deviation (Population)5.6%4.9%

Similar Demographics by Poverty

Demographics Similar to Nepalese by Poverty

In terms of poverty, the demographic groups most similar to Nepalese are Sudanese (14.0%, a difference of 0.030%), Ecuadorian (14.0%, a difference of 0.10%), Immigrants from Sudan (14.1%, a difference of 0.39%), Salvadoran (14.0%, a difference of 0.41%), and Immigrants from Middle Africa (14.0%, a difference of 0.44%).
DemographicsRating | RankPoverty
French American Indians
0.5
/100
|
#237
Tragic
13.9%
Ghanaians
0.5
/100
|
#238
Tragic
13.9%
Nicaraguans
0.4
/100
|
#239
Tragic
13.9%
Immigrants | Middle Africa
0.4
/100
|
#240
Tragic
14.0%
Salvadorans
0.4
/100
|
#241
Tragic
14.0%
Ecuadorians
0.4
/100
|
#242
Tragic
14.0%
Sudanese
0.3
/100
|
#243
Tragic
14.0%
Nepalese
0.3
/100
|
#244
Tragic
14.0%
Immigrants | Sudan
0.3
/100
|
#245
Tragic
14.1%
Potawatomi
0.3
/100
|
#246
Tragic
14.1%
Liberians
0.2
/100
|
#247
Tragic
14.1%
Immigrants | Western Africa
0.2
/100
|
#248
Tragic
14.1%
Immigrants | Ghana
0.2
/100
|
#249
Tragic
14.2%
Cree
0.2
/100
|
#250
Tragic
14.2%
Immigrants | Burma/Myanmar
0.2
/100
|
#251
Tragic
14.2%

Demographics Similar to Maltese by Poverty

In terms of poverty, the demographic groups most similar to Maltese are Filipino (10.1%, a difference of 0.42%), Immigrants from South Central Asia (10.2%, a difference of 0.45%), Assyrian/Chaldean/Syriac (10.1%, a difference of 0.56%), Immigrants from Ireland (10.1%, a difference of 0.74%), and Bulgarian (10.2%, a difference of 0.86%).
DemographicsRating | RankPoverty
Immigrants | India
100.0
/100
|
#1
Exceptional
9.0%
Chinese
100.0
/100
|
#2
Exceptional
9.5%
Thais
100.0
/100
|
#3
Exceptional
9.6%
Immigrants | Taiwan
100.0
/100
|
#4
Exceptional
9.7%
Immigrants | Ireland
99.9
/100
|
#5
Exceptional
10.1%
Assyrians/Chaldeans/Syriacs
99.9
/100
|
#6
Exceptional
10.1%
Filipinos
99.9
/100
|
#7
Exceptional
10.1%
Maltese
99.9
/100
|
#8
Exceptional
10.2%
Immigrants | South Central Asia
99.9
/100
|
#9
Exceptional
10.2%
Bulgarians
99.9
/100
|
#10
Exceptional
10.2%
Immigrants | Lithuania
99.9
/100
|
#11
Exceptional
10.3%
Bhutanese
99.8
/100
|
#12
Exceptional
10.4%
Immigrants | Hong Kong
99.8
/100
|
#13
Exceptional
10.4%
Immigrants | Bolivia
99.8
/100
|
#14
Exceptional
10.4%
Bolivians
99.8
/100
|
#15
Exceptional
10.4%