Nepalese vs Immigrants from Mexico Female Poverty

COMPARE

Nepalese
Race
Ancestry
AfghanAfricanAlaska NativeAlaskan AthabascanAlbanianAleutAlsatianAmericanApacheArabArapahoArgentineanArmenianAssyrian/Chaldean/SyriacAustralianAustrianBahamianBangladeshiBarbadianBasqueBelgianBelizeanBermudanBhutaneseBlackfeetBolivianBrazilianBritishBritish West IndianBulgarianBurmeseCajunCambodianCanadianCape VerdeanCarpatho RusynCelticCentral AmericanCentral American IndianCherokeeCheyenneChickasawChileanChineseChippewaChoctawColombianColvilleComancheCosta RicanCreeCreekCroatianCrowCubanCypriotCzechCzechoslovakianDanishDelawareDominicanDutchDutch West IndianEastern EuropeanEcuadorianEgyptianEnglishEstonianEthiopianEuropeanFijianFilipinoFinnishFrenchFrench American IndianFrench CanadianGermanGerman RussianGhanaianGreekGuamanian/ChamorroGuatemalanGuyaneseHaitianHmongHonduranHopiHoumaHungarianIcelanderIndian (Asian)IndonesianInupiatIranianIraqiIrishIroquoisIsraeliItalianJamaicanJapaneseJordanianKenyanKiowaKoreanLaotianLatvianLebaneseLiberianLithuanianLumbeeLuxembourgerMacedonianMalaysianMalteseMarshalleseMenomineeMexicanMexican American IndianMongolianMoroccanNative HawaiianNavajoNepaleseNew ZealanderNicaraguanNigerianNorthern EuropeanNorwegianOkinawanOsageOttawaPaiutePakistaniPalestinianPanamanianParaguayanPennsylvania GermanPeruvianPimaPolishPortuguesePotawatomiPuebloPuerto RicanPuget Sound SalishRomanianRussianSalvadoranSamoanScandinavianScotch-IrishScottishSeminoleSenegaleseSerbianShoshoneSierra LeoneanSiouxSlavicSlovakSloveneSomaliSouth AfricanSouth AmericanSouth American IndianSoviet UnionSpaniardSpanishSpanish AmericanSpanish American IndianSri LankanSubsaharan AfricanSudaneseSwedishSwissSyrianTaiwaneseThaiTlingit-HaidaTohono O'OdhamTonganTrinidadian and TobagonianTsimshianTurkishU.S. Virgin IslanderUgandanUkrainianUruguayanUteVenezuelanVietnameseWelshWest IndianYakamaYaquiYugoslavianYumanYup'ikZimbabwean
Immigration
NonimmigrantsImmigrantsAfghanistanAfricaAlbaniaArgentinaArmeniaAsiaAustraliaAustriaBahamasBangladeshBarbadosBelarusBelgiumBelizeBoliviaBosnia and HerzegovinaBrazilBulgariaBurma/MyanmarCabo VerdeCambodiaCameroonCanadaCaribbeanCentral AmericaChileChinaColombiaCongoCosta RicaCroatiaCubaCzechoslovakiaDenmarkDominicaDominican RepublicEastern AfricaEastern AsiaEastern EuropeEcuadorEgyptEl SalvadorEnglandEritreaEthiopiaEuropeFijiFranceGermanyGhanaGreeceGrenadaGuatemalaGuyanaHaitiHondurasHong KongHungaryIndiaIndonesiaIranIraqIrelandIsraelItalyJamaicaJapanJordanKazakhstanKenyaKoreaKuwaitLaosLatin AmericaLatviaLebanonLiberiaLithuaniaMalaysiaMicronesiaMiddle AfricaMoldovaMoroccoNepalNetherlandsNicaraguaNigeriaNorth AmericaNorth MacedoniaNorthern AfricaNorthern EuropeNorwayOceaniaPakistanPanamaPeruPhilippinesPolandPortugalRomaniaRussiaSaudi ArabiaScotlandSenegalSerbiaSierra LeoneSingaporeSomaliaSouth AfricaSouth AmericaSouth Central AsiaSouth Eastern AsiaSouthern EuropeSpainSri LankaSt. Vincent and the GrenadinesSudanSwedenSwitzerlandSyriaTaiwanThailandTrinidad and TobagoTurkeyUgandaUkraineUruguayUzbekistanVenezuelaVietnamWest IndiesWestern AfricaWestern AsiaWestern EuropeYemenZaireZimbabweAzores
Immigrants from Mexico
Race
Ancestry
AfghanAfricanAlaska NativeAlaskan AthabascanAlbanianAleutAlsatianAmericanApacheArabArapahoArgentineanArmenianAssyrian/Chaldean/SyriacAustralianAustrianBahamianBangladeshiBarbadianBasqueBelgianBelizeanBermudanBhutaneseBlackfeetBolivianBrazilianBritishBritish West IndianBulgarianBurmeseCajunCambodianCanadianCape VerdeanCarpatho RusynCelticCentral AmericanCentral American IndianCherokeeCheyenneChickasawChileanChineseChippewaChoctawColombianColvilleComancheCosta RicanCreeCreekCroatianCrowCubanCypriotCzechCzechoslovakianDanishDelawareDominicanDutchDutch West IndianEastern EuropeanEcuadorianEgyptianEnglishEstonianEthiopianEuropeanFijianFilipinoFinnishFrenchFrench American IndianFrench CanadianGermanGerman RussianGhanaianGreekGuamanian/ChamorroGuatemalanGuyaneseHaitianHmongHonduranHopiHoumaHungarianIcelanderIndian (Asian)IndonesianInupiatIranianIraqiIrishIroquoisIsraeliItalianJamaicanJapaneseJordanianKenyanKiowaKoreanLaotianLatvianLebaneseLiberianLithuanianLumbeeLuxembourgerMacedonianMalaysianMalteseMarshalleseMenomineeMexicanMexican American IndianMongolianMoroccanNative HawaiianNavajoNew ZealanderNicaraguanNigerianNorthern EuropeanNorwegianOkinawanOsageOttawaPaiutePakistaniPalestinianPanamanianParaguayanPennsylvania GermanPeruvianPimaPolishPortuguesePotawatomiPuebloPuerto RicanPuget Sound SalishRomanianRussianSalvadoranSamoanScandinavianScotch-IrishScottishSeminoleSenegaleseSerbianShoshoneSierra LeoneanSiouxSlavicSlovakSloveneSomaliSouth AfricanSouth AmericanSouth American IndianSoviet UnionSpaniardSpanishSpanish AmericanSpanish American IndianSri LankanSubsaharan AfricanSudaneseSwedishSwissSyrianTaiwaneseThaiTlingit-HaidaTohono O'OdhamTonganTrinidadian and TobagonianTsimshianTurkishU.S. Virgin IslanderUgandanUkrainianUruguayanUteVenezuelanVietnameseWelshWest IndianYakamaYaquiYugoslavianYumanYup'ikZimbabwean
Immigration
NonimmigrantsImmigrantsAfghanistanAfricaAlbaniaArgentinaArmeniaAsiaAustraliaAustriaBahamasBangladeshBarbadosBelarusBelgiumBelizeBoliviaBosnia and HerzegovinaBrazilBulgariaBurma/MyanmarCabo VerdeCambodiaCameroonCanadaCaribbeanCentral AmericaChileChinaColombiaCongoCosta RicaCroatiaCubaCzechoslovakiaDenmarkDominicaDominican RepublicEastern AfricaEastern AsiaEastern EuropeEcuadorEgyptEl SalvadorEnglandEritreaEthiopiaEuropeFijiFranceGermanyGhanaGreeceGrenadaGuatemalaGuyanaHaitiHondurasHong KongHungaryIndiaIndonesiaIranIraqIrelandIsraelItalyJamaicaJapanJordanKazakhstanKenyaKoreaKuwaitLaosLatin AmericaLatviaLebanonLiberiaLithuaniaMalaysiaMexicoMicronesiaMiddle AfricaMoldovaMoroccoNepalNetherlandsNicaraguaNigeriaNorth AmericaNorth MacedoniaNorthern AfricaNorthern EuropeNorwayOceaniaPakistanPanamaPeruPhilippinesPolandPortugalRomaniaRussiaSaudi ArabiaScotlandSenegalSerbiaSierra LeoneSingaporeSomaliaSouth AfricaSouth AmericaSouth Central AsiaSouth Eastern AsiaSouthern EuropeSpainSri LankaSt. Vincent and the GrenadinesSudanSwedenSwitzerlandSyriaTaiwanThailandTrinidad and TobagoTurkeyUgandaUkraineUruguayUzbekistanVenezuelaVietnamWest IndiesWestern AfricaWestern AsiaWestern EuropeYemenZaireZimbabweAzores
Female Poverty
Income
Poverty
Unemployment
Labor Participation
Family Structure
Vehicle Availability
Education Level
Disability

Female Poverty Comparison

Nepalese

Immigrants from Mexico

Tragic
Tragic
15.2%
FEMALE POVERTY
0.4/ 100
METRIC RATING
242nd/ 347
METRIC RANK
17.0%
FEMALE POVERTY
0.0/ 100
METRIC RATING
309th/ 347
METRIC RANK

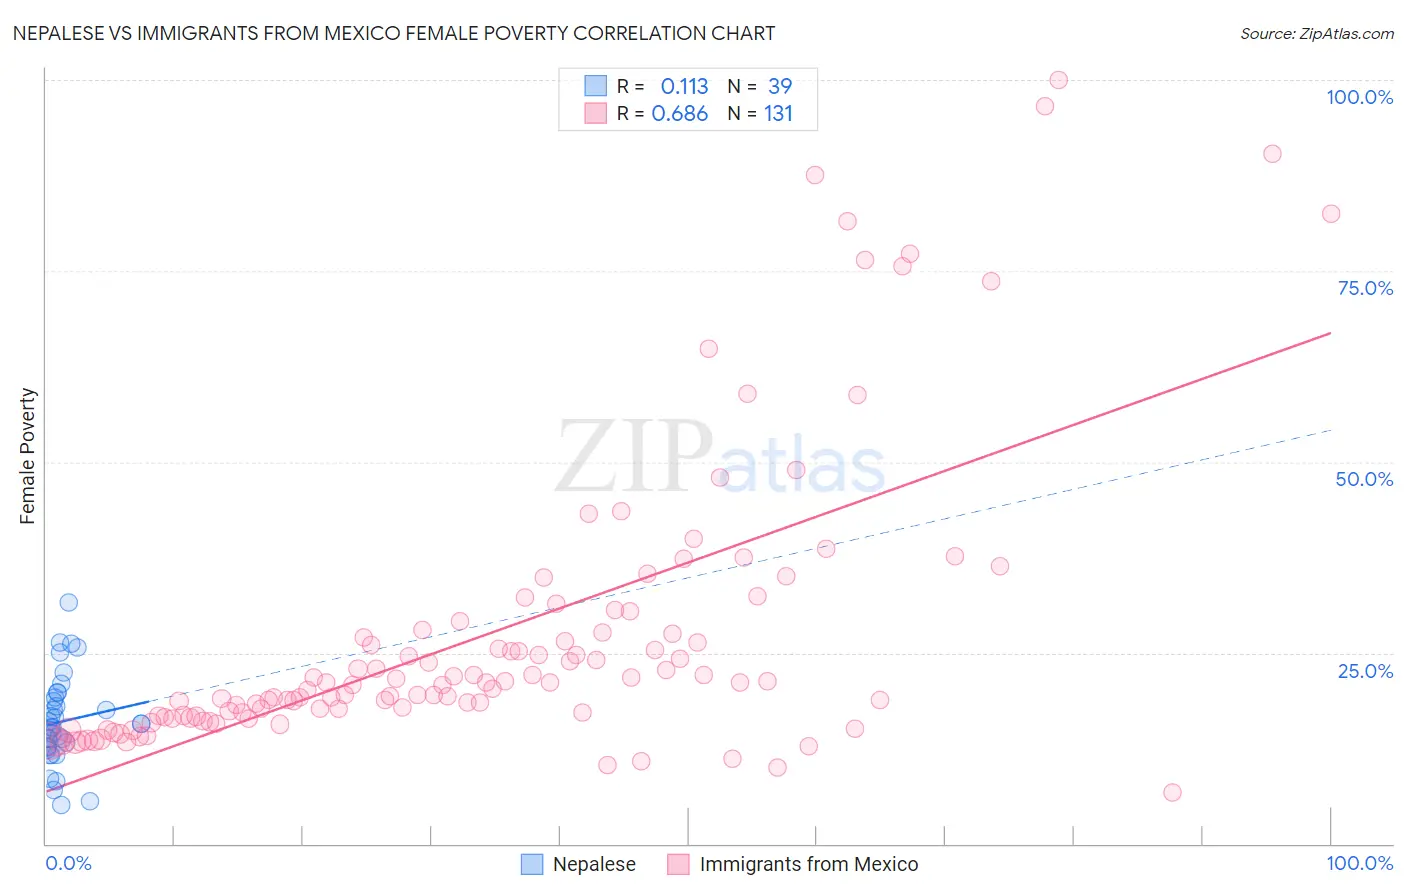
Nepalese vs Immigrants from Mexico Female Poverty Correlation Chart

The statistical analysis conducted on geographies consisting of 24,519,269 people shows a poor positive correlation between the proportion of Nepalese and poverty level among females in the United States with a correlation coefficient (R) of 0.113 and weighted average of 15.2%. Similarly, the statistical analysis conducted on geographies consisting of 513,228,632 people shows a significant positive correlation between the proportion of Immigrants from Mexico and poverty level among females in the United States with a correlation coefficient (R) of 0.686 and weighted average of 17.0%, a difference of 11.3%.
Nepalese vs Immigrants from Mexico Female Poverty

Female Poverty Correlation Summary

MeasurementNepaleseImmigrants from Mexico
Minimum5.1%6.7%
Maximum31.6%100.0%
Range26.5%93.3%
Mean16.0%27.4%
Median15.3%21.1%
Interquartile 25% (IQ1)12.6%16.7%
Interquartile 75% (IQ3)19.2%28.0%
Interquartile Range (IQR)6.5%11.3%
Standard Deviation (Sample)5.8%19.2%
Standard Deviation (Population)5.8%19.1%

Similar Demographics by Female Poverty

Demographics Similar to Nepalese by Female Poverty

In terms of female poverty, the demographic groups most similar to Nepalese are Immigrants from Sudan (15.2%, a difference of 0.12%), Nicaraguan (15.3%, a difference of 0.24%), Ecuadorian (15.3%, a difference of 0.29%), Sudanese (15.2%, a difference of 0.37%), and Spanish American Indian (15.3%, a difference of 0.39%).
DemographicsRating | RankFemale Poverty
Immigrants | Laos
0.9
/100
|
#235
Tragic
15.0%
Cree
0.7
/100
|
#236
Tragic
15.1%
French American Indians
0.6
/100
|
#237
Tragic
15.1%
Immigrants | Armenia
0.6
/100
|
#238
Tragic
15.1%
Immigrants | Middle Africa
0.5
/100
|
#239
Tragic
15.2%
Sudanese
0.5
/100
|
#240
Tragic
15.2%
Immigrants | Sudan
0.4
/100
|
#241
Tragic
15.2%
Nepalese
0.4
/100
|
#242
Tragic
15.2%
Nicaraguans
0.3
/100
|
#243
Tragic
15.3%
Ecuadorians
0.3
/100
|
#244
Tragic
15.3%
Spanish American Indians
0.3
/100
|
#245
Tragic
15.3%
Cubans
0.3
/100
|
#246
Tragic
15.3%
Potawatomi
0.3
/100
|
#247
Tragic
15.3%
Immigrants | Ghana
0.3
/100
|
#248
Tragic
15.3%
Salvadorans
0.3
/100
|
#249
Tragic
15.3%

Demographics Similar to Immigrants from Mexico by Female Poverty

In terms of female poverty, the demographic groups most similar to Immigrants from Mexico are Creek (17.0%, a difference of 0.24%), Immigrants from Guatemala (17.0%, a difference of 0.24%), Immigrants from Somalia (17.0%, a difference of 0.34%), African (16.9%, a difference of 0.39%), and British West Indian (17.0%, a difference of 0.41%).
DemographicsRating | RankFemale Poverty
Chippewa
0.0
/100
|
#302
Tragic
16.7%
Choctaw
0.0
/100
|
#303
Tragic
16.8%
Immigrants | Central America
0.0
/100
|
#304
Tragic
16.8%
Immigrants | Grenada
0.0
/100
|
#305
Tragic
16.8%
Immigrants | Caribbean
0.0
/100
|
#306
Tragic
16.9%
Seminole
0.0
/100
|
#307
Tragic
16.9%
Africans
0.0
/100
|
#308
Tragic
16.9%
Immigrants | Mexico
0.0
/100
|
#309
Tragic
17.0%
Creek
0.0
/100
|
#310
Tragic
17.0%
Immigrants | Guatemala
0.0
/100
|
#311
Tragic
17.0%
Immigrants | Somalia
0.0
/100
|
#312
Tragic
17.0%
British West Indians
0.0
/100
|
#313
Tragic
17.0%
Dutch West Indians
0.0
/100
|
#314
Tragic
17.1%
U.S. Virgin Islanders
0.0
/100
|
#315
Tragic
17.3%
Hondurans
0.0
/100
|
#316
Tragic
17.4%