Nepalese vs Alaska Native Male Poverty
COMPARE
Nepalese
Alaska Native
Male Poverty
Male Poverty Comparison
Nepalese
Alaska Natives
12.8%
MALE POVERTY
0.3/ 100
METRIC RATING
242nd/ 347
METRIC RANK
12.4%
MALE POVERTY
1.4/ 100
METRIC RATING
227th/ 347
METRIC RANK
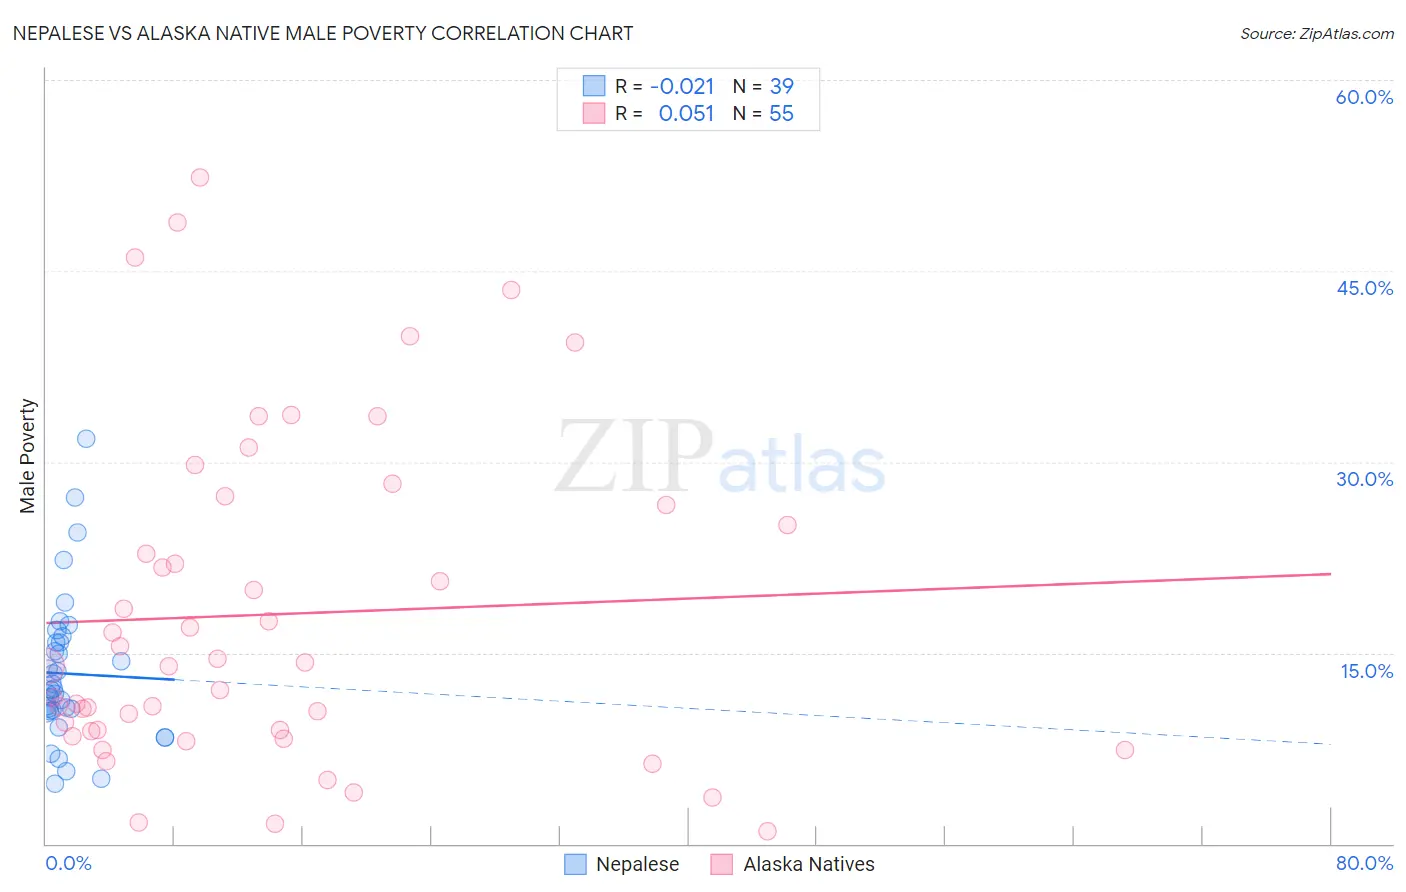
Nepalese vs Alaska Native Male Poverty Correlation Chart
The statistical analysis conducted on geographies consisting of 24,519,269 people shows no correlation between the proportion of Nepalese and poverty level among males in the United States with a correlation coefficient (R) of -0.021 and weighted average of 12.8%. Similarly, the statistical analysis conducted on geographies consisting of 76,750,766 people shows a slight positive correlation between the proportion of Alaska Natives and poverty level among males in the United States with a correlation coefficient (R) of 0.051 and weighted average of 12.4%, a difference of 3.4%.
Male Poverty Correlation Summary
| Measurement | Nepalese | Alaska Native |
| Minimum | 4.7% | 0.96% |
| Maximum | 31.9% | 52.4% |
| Range | 27.2% | 51.4% |
| Mean | 13.4% | 18.0% |
| Median | 12.1% | 14.0% |
| Interquartile 25% (IQ1) | 10.4% | 8.8% |
| Interquartile 75% (IQ3) | 15.8% | 26.6% |
| Interquartile Range (IQR) | 5.4% | 17.8% |
| Standard Deviation (Sample) | 5.8% | 12.9% |
| Standard Deviation (Population) | 5.7% | 12.8% |
Demographics Similar to Nepalese and Alaska Natives by Male Poverty
In terms of male poverty, the demographic groups most similar to Nepalese are Alaskan Athabascan (12.8%, a difference of 0.040%), Tsimshian (12.8%, a difference of 0.14%), Sudanese (12.8%, a difference of 0.17%), Immigrants from Middle Africa (12.7%, a difference of 0.53%), and Ecuadorian (12.7%, a difference of 0.80%). Similarly, the demographic groups most similar to Alaska Natives are Alsatian (12.4%, a difference of 0.040%), Nigerian (12.3%, a difference of 0.090%), Cuban (12.4%, a difference of 0.13%), Osage (12.3%, a difference of 0.26%), and Immigrants from Nigeria (12.3%, a difference of 0.32%).
| Demographics | Rating | Rank | Male Poverty |
| Immigrants | Nigeria | 1.6 /100 | #224 | Tragic 12.3% |
| Osage | 1.5 /100 | #225 | Tragic 12.3% |
| Nigerians | 1.4 /100 | #226 | Tragic 12.3% |
| Alaska Natives | 1.4 /100 | #227 | Tragic 12.4% |
| Alsatians | 1.3 /100 | #228 | Tragic 12.4% |
| Cubans | 1.3 /100 | #229 | Tragic 12.4% |
| Marshallese | 0.8 /100 | #230 | Tragic 12.5% |
| Salvadorans | 0.6 /100 | #231 | Tragic 12.6% |
| Nicaraguans | 0.6 /100 | #232 | Tragic 12.6% |
| Fijians | 0.6 /100 | #233 | Tragic 12.6% |
| Immigrants | Armenia | 0.6 /100 | #234 | Tragic 12.6% |
| Immigrants | Laos | 0.5 /100 | #235 | Tragic 12.6% |
| Immigrants | Saudi Arabia | 0.4 /100 | #236 | Tragic 12.7% |
| French American Indians | 0.4 /100 | #237 | Tragic 12.7% |
| Ecuadorians | 0.4 /100 | #238 | Tragic 12.7% |
| Ghanaians | 0.4 /100 | #239 | Tragic 12.7% |
| Immigrants | Middle Africa | 0.4 /100 | #240 | Tragic 12.7% |
| Sudanese | 0.3 /100 | #241 | Tragic 12.8% |
| Nepalese | 0.3 /100 | #242 | Tragic 12.8% |
| Alaskan Athabascans | 0.3 /100 | #243 | Tragic 12.8% |
| Tsimshian | 0.3 /100 | #244 | Tragic 12.8% |