Native/Alaskan vs Immigrants from France Child Poverty Under the Age of 16
COMPARE
Native/Alaskan
Immigrants from France
Child Poverty Under the Age of 16
Child Poverty Under the Age of 16 Comparison
Natives/Alaskans
Immigrants from France
23.8%
CHILD POVERTY UNDER THE AGE OF 16
0.0/ 100
METRIC RATING
330th/ 347
METRIC RANK
14.7%
CHILD POVERTY UNDER THE AGE OF 16
95.8/ 100
METRIC RATING
96th/ 347
METRIC RANK
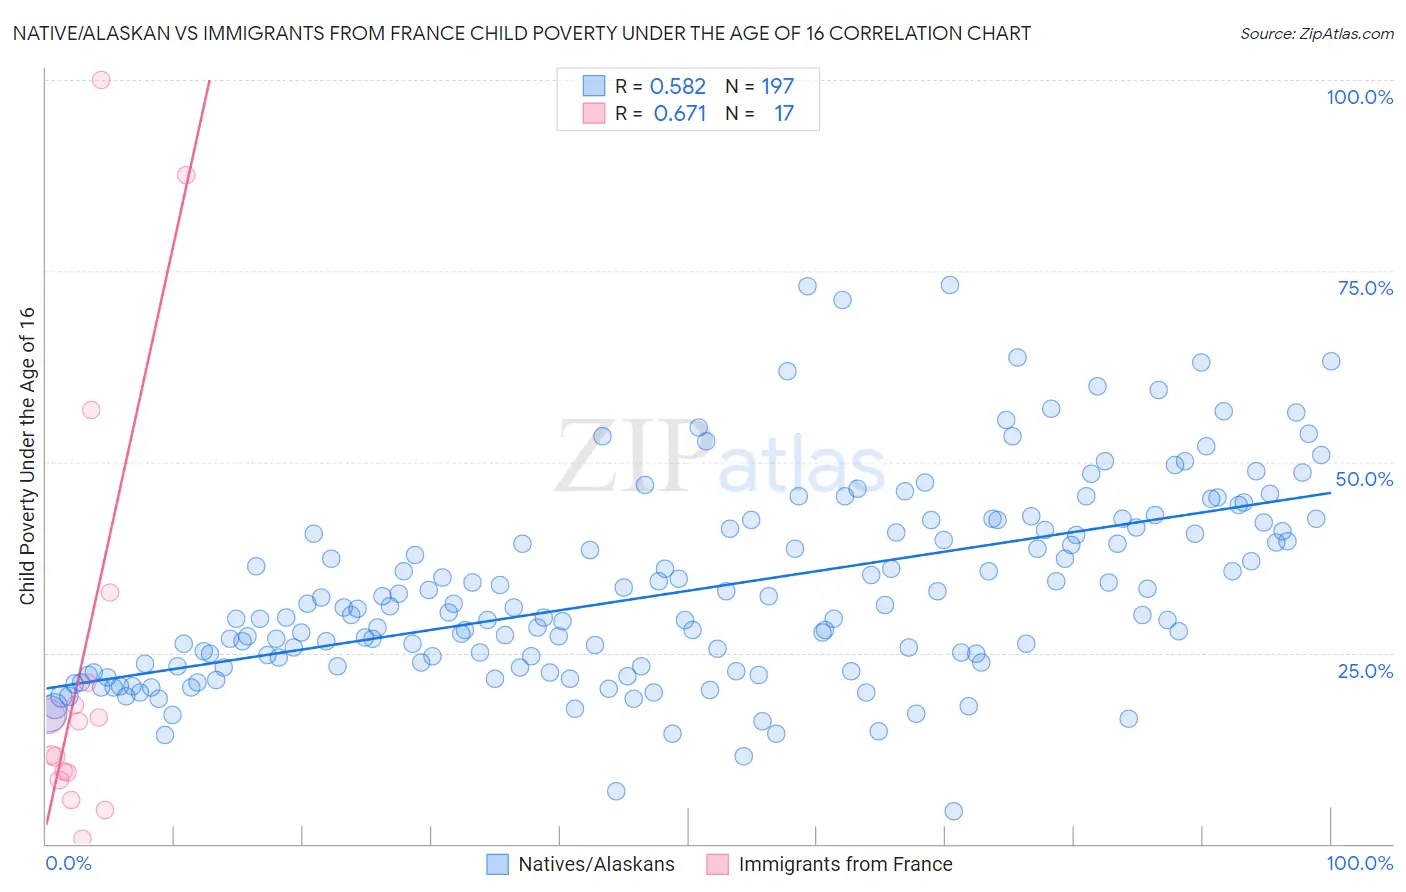
Native/Alaskan vs Immigrants from France Child Poverty Under the Age of 16 Correlation Chart
The statistical analysis conducted on geographies consisting of 507,337,670 people shows a substantial positive correlation between the proportion of Natives/Alaskans and poverty level among children under the age of 16 in the United States with a correlation coefficient (R) of 0.582 and weighted average of 23.8%. Similarly, the statistical analysis conducted on geographies consisting of 285,695,647 people shows a significant positive correlation between the proportion of Immigrants from France and poverty level among children under the age of 16 in the United States with a correlation coefficient (R) of 0.671 and weighted average of 14.7%, a difference of 62.0%.
Child Poverty Under the Age of 16 Correlation Summary
| Measurement | Native/Alaskan | Immigrants from France |
| Minimum | 4.2% | 0.60% |
| Maximum | 73.1% | 100.0% |
| Range | 68.9% | 99.4% |
| Mean | 33.1% | 25.1% |
| Median | 30.2% | 16.0% |
| Interquartile 25% (IQ1) | 23.3% | 8.9% |
| Interquartile 75% (IQ3) | 41.1% | 27.0% |
| Interquartile Range (IQR) | 17.8% | 18.1% |
| Standard Deviation (Sample) | 12.8% | 28.9% |
| Standard Deviation (Population) | 12.8% | 28.1% |
Similar Demographics by Child Poverty Under the Age of 16
Demographics Similar to Natives/Alaskans by Child Poverty Under the Age of 16
In terms of child poverty under the age of 16, the demographic groups most similar to Natives/Alaskans are Dominican (23.8%, a difference of 0.090%), Apache (23.8%, a difference of 0.22%), Pueblo (23.9%, a difference of 0.60%), Immigrants from Dominican Republic (24.0%, a difference of 0.78%), and Black/African American (24.4%, a difference of 2.8%).
| Demographics | Rating | Rank | Child Poverty Under the Age of 16 |
| Paiute | 0.0 /100 | #323 | Tragic 22.4% |
| Central American Indians | 0.0 /100 | #324 | Tragic 22.5% |
| Immigrants | Congo | 0.0 /100 | #325 | Tragic 22.5% |
| Immigrants | Honduras | 0.0 /100 | #326 | Tragic 22.7% |
| Menominee | 0.0 /100 | #327 | Tragic 23.0% |
| Colville | 0.0 /100 | #328 | Tragic 23.0% |
| Dominicans | 0.0 /100 | #329 | Tragic 23.8% |
| Natives/Alaskans | 0.0 /100 | #330 | Tragic 23.8% |
| Apache | 0.0 /100 | #331 | Tragic 23.8% |
| Pueblo | 0.0 /100 | #332 | Tragic 23.9% |
| Immigrants | Dominican Republic | 0.0 /100 | #333 | Tragic 24.0% |
| Blacks/African Americans | 0.0 /100 | #334 | Tragic 24.4% |
| Houma | 0.0 /100 | #335 | Tragic 24.9% |
| Yup'ik | 0.0 /100 | #336 | Tragic 25.1% |
| Sioux | 0.0 /100 | #337 | Tragic 25.2% |
Demographics Similar to Immigrants from France by Child Poverty Under the Age of 16
In terms of child poverty under the age of 16, the demographic groups most similar to Immigrants from France are Paraguayan (14.7%, a difference of 0.12%), Immigrants from Belarus (14.7%, a difference of 0.13%), Immigrants from Croatia (14.6%, a difference of 0.25%), British (14.7%, a difference of 0.25%), and Immigrants from South Africa (14.6%, a difference of 0.41%).
| Demographics | Rating | Rank | Child Poverty Under the Age of 16 |
| Germans | 96.9 /100 | #89 | Exceptional 14.5% |
| Austrians | 96.9 /100 | #90 | Exceptional 14.5% |
| Immigrants | North America | 96.7 /100 | #91 | Exceptional 14.6% |
| Immigrants | Italy | 96.7 /100 | #92 | Exceptional 14.6% |
| Argentineans | 96.6 /100 | #93 | Exceptional 14.6% |
| Immigrants | South Africa | 96.3 /100 | #94 | Exceptional 14.6% |
| Immigrants | Croatia | 96.1 /100 | #95 | Exceptional 14.6% |
| Immigrants | France | 95.8 /100 | #96 | Exceptional 14.7% |
| Paraguayans | 95.7 /100 | #97 | Exceptional 14.7% |
| Immigrants | Belarus | 95.7 /100 | #98 | Exceptional 14.7% |
| British | 95.5 /100 | #99 | Exceptional 14.7% |
| Dutch | 95.1 /100 | #100 | Exceptional 14.8% |
| Immigrants | Switzerland | 95.1 /100 | #101 | Exceptional 14.8% |
| Romanians | 95.0 /100 | #102 | Exceptional 14.8% |
| Immigrants | Egypt | 94.9 /100 | #103 | Exceptional 14.8% |