Native/Alaskan vs European Child Poverty Under the Age of 5

COMPARE

Native/Alaskan
Race
Ancestry
AfghanAfricanAlaska NativeAlaskan AthabascanAlbanianAleutAlsatianAmericanApacheArabArapahoArgentineanArmenianAssyrian/Chaldean/SyriacAustralianAustrianBahamianBangladeshiBarbadianBasqueBelgianBelizeanBermudanBhutaneseBlackfeetBolivianBrazilianBritishBritish West IndianBulgarianBurmeseCajunCambodianCanadianCape VerdeanCarpatho RusynCelticCentral AmericanCentral American IndianCherokeeCheyenneChickasawChileanChineseChippewaChoctawColombianColvilleComancheCosta RicanCreeCreekCroatianCrowCubanCypriotCzechCzechoslovakianDanishDelawareDominicanDutchDutch West IndianEastern EuropeanEcuadorianEgyptianEnglishEstonianEthiopianFijianFilipinoFinnishFrenchFrench American IndianFrench CanadianGermanGerman RussianGhanaianGreekGuamanian/ChamorroGuatemalanGuyaneseHaitianHmongHonduranHopiHoumaHungarianIcelanderIndian (Asian)IndonesianInupiatIranianIraqiIrishIroquoisIsraeliItalianJamaicanJapaneseJordanianKenyanKiowaKoreanLaotianLatvianLebaneseLiberianLithuanianLumbeeLuxembourgerMacedonianMalaysianMalteseMarshalleseMenomineeMexicanMexican American IndianMongolianMoroccanNative HawaiianNavajoNepaleseNew ZealanderNicaraguanNigerianNorthern EuropeanNorwegianOkinawanOsageOttawaPaiutePakistaniPalestinianPanamanianParaguayanPennsylvania GermanPeruvianPimaPolishPortuguesePotawatomiPuebloPuerto RicanPuget Sound SalishRomanianRussianSalvadoranSamoanScandinavianScotch-IrishScottishSeminoleSenegaleseSerbianShoshoneSierra LeoneanSiouxSlavicSlovakSloveneSomaliSouth AfricanSouth AmericanSouth American IndianSoviet UnionSpaniardSpanishSpanish AmericanSpanish American IndianSri LankanSubsaharan AfricanSudaneseSwedishSwissSyrianTaiwaneseThaiTlingit-HaidaTohono O'OdhamTonganTrinidadian and TobagonianTsimshianTurkishU.S. Virgin IslanderUgandanUkrainianUruguayanUteVenezuelanVietnameseWelshWest IndianYakamaYaquiYugoslavianYumanYup'ikZimbabwean
Immigration
NonimmigrantsImmigrantsAfghanistanAfricaAlbaniaArgentinaArmeniaAsiaAustraliaAustriaBahamasBangladeshBarbadosBelarusBelgiumBelizeBoliviaBosnia and HerzegovinaBrazilBulgariaBurma/MyanmarCabo VerdeCambodiaCameroonCanadaCaribbeanCentral AmericaChileChinaColombiaCongoCosta RicaCroatiaCubaCzechoslovakiaDenmarkDominicaDominican RepublicEastern AfricaEastern AsiaEastern EuropeEcuadorEgyptEl SalvadorEnglandEritreaEthiopiaEuropeFijiFranceGermanyGhanaGreeceGrenadaGuatemalaGuyanaHaitiHondurasHong KongHungaryIndiaIndonesiaIranIraqIrelandIsraelItalyJamaicaJapanJordanKazakhstanKenyaKoreaKuwaitLaosLatin AmericaLatviaLebanonLiberiaLithuaniaMalaysiaMexicoMicronesiaMiddle AfricaMoldovaMoroccoNepalNetherlandsNicaraguaNigeriaNorth AmericaNorth MacedoniaNorthern AfricaNorthern EuropeNorwayOceaniaPakistanPanamaPeruPhilippinesPolandPortugalRomaniaRussiaSaudi ArabiaScotlandSenegalSerbiaSierra LeoneSingaporeSomaliaSouth AfricaSouth AmericaSouth Central AsiaSouth Eastern AsiaSouthern EuropeSpainSri LankaSt. Vincent and the GrenadinesSudanSwedenSwitzerlandSyriaTaiwanThailandTrinidad and TobagoTurkeyUgandaUkraineUruguayUzbekistanVenezuelaVietnamWest IndiesWestern AfricaWestern AsiaWestern EuropeYemenZaireZimbabweAzores
European
Race
Ancestry
AfghanAfricanAlaska NativeAlaskan AthabascanAlbanianAleutAlsatianAmericanApacheArabArapahoArgentineanArmenianAssyrian/Chaldean/SyriacAustralianAustrianBahamianBangladeshiBarbadianBasqueBelgianBelizeanBermudanBhutaneseBlackfeetBolivianBrazilianBritishBritish West IndianBulgarianBurmeseCajunCambodianCanadianCape VerdeanCarpatho RusynCelticCentral AmericanCentral American IndianCherokeeCheyenneChickasawChileanChineseChippewaChoctawColombianColvilleComancheCosta RicanCreeCreekCroatianCrowCubanCypriotCzechCzechoslovakianDanishDelawareDominicanDutchDutch West IndianEastern EuropeanEcuadorianEgyptianEnglishEstonianEthiopianEuropeanFijianFilipinoFinnishFrenchFrench American IndianFrench CanadianGermanGerman RussianGhanaianGreekGuamanian/ChamorroGuatemalanGuyaneseHaitianHmongHonduranHopiHoumaHungarianIcelanderIndian (Asian)IndonesianInupiatIranianIraqiIrishIroquoisIsraeliItalianJamaicanJapaneseJordanianKenyanKiowaKoreanLaotianLatvianLebaneseLiberianLithuanianLumbeeLuxembourgerMacedonianMalaysianMalteseMarshalleseMenomineeMexicanMexican American IndianMongolianMoroccanNative HawaiianNavajoNepaleseNew ZealanderNicaraguanNigerianNorthern EuropeanNorwegianOkinawanOsageOttawaPaiutePakistaniPalestinianPanamanianParaguayanPennsylvania GermanPeruvianPimaPolishPortuguesePotawatomiPuebloPuerto RicanPuget Sound SalishRomanianRussianSalvadoranSamoanScandinavianScotch-IrishScottishSeminoleSenegaleseSerbianShoshoneSierra LeoneanSiouxSlavicSlovakSloveneSomaliSouth AfricanSouth AmericanSouth American IndianSoviet UnionSpaniardSpanishSpanish AmericanSpanish American IndianSri LankanSubsaharan AfricanSudaneseSwedishSwissSyrianTaiwaneseThaiTlingit-HaidaTohono O'OdhamTonganTrinidadian and TobagonianTsimshianTurkishU.S. Virgin IslanderUgandanUkrainianUruguayanUteVenezuelanVietnameseWelshWest IndianYakamaYaquiYugoslavianYumanYup'ikZimbabwean
Immigration
NonimmigrantsImmigrantsAfghanistanAfricaAlbaniaArgentinaArmeniaAsiaAustraliaAustriaBahamasBangladeshBarbadosBelarusBelgiumBelizeBoliviaBosnia and HerzegovinaBrazilBulgariaBurma/MyanmarCabo VerdeCambodiaCameroonCanadaCaribbeanCentral AmericaChileChinaColombiaCongoCosta RicaCroatiaCubaCzechoslovakiaDenmarkDominicaDominican RepublicEastern AfricaEastern AsiaEastern EuropeEcuadorEgyptEl SalvadorEnglandEritreaEthiopiaEuropeFijiFranceGermanyGhanaGreeceGrenadaGuatemalaGuyanaHaitiHondurasHong KongHungaryIndiaIndonesiaIranIraqIrelandIsraelItalyJamaicaJapanJordanKazakhstanKenyaKoreaKuwaitLaosLatin AmericaLatviaLebanonLiberiaLithuaniaMalaysiaMexicoMicronesiaMiddle AfricaMoldovaMoroccoNepalNetherlandsNicaraguaNigeriaNorth AmericaNorth MacedoniaNorthern AfricaNorthern EuropeNorwayOceaniaPakistanPanamaPeruPhilippinesPolandPortugalRomaniaRussiaSaudi ArabiaScotlandSenegalSerbiaSierra LeoneSingaporeSomaliaSouth AfricaSouth AmericaSouth Central AsiaSouth Eastern AsiaSouthern EuropeSpainSri LankaSt. Vincent and the GrenadinesSudanSwedenSwitzerlandSyriaTaiwanThailandTrinidad and TobagoTurkeyUgandaUkraineUruguayUzbekistanVenezuelaVietnamWest IndiesWestern AfricaWestern AsiaWestern EuropeYemenZaireZimbabweAzores
Child Poverty Under the Age of 5
Income
Poverty
Unemployment
Labor Participation
Family Structure
Vehicle Availability
Education Level
Disability

Child Poverty Under the Age of 5 Comparison

Natives/Alaskans

Europeans

Tragic
Exceptional
25.6%
CHILD POVERTY UNDER THE AGE OF 5
0.0/ 100
METRIC RATING
333rd/ 347
METRIC RANK
15.9%
CHILD POVERTY UNDER THE AGE OF 5
95.3/ 100
METRIC RATING
103rd/ 347
METRIC RANK

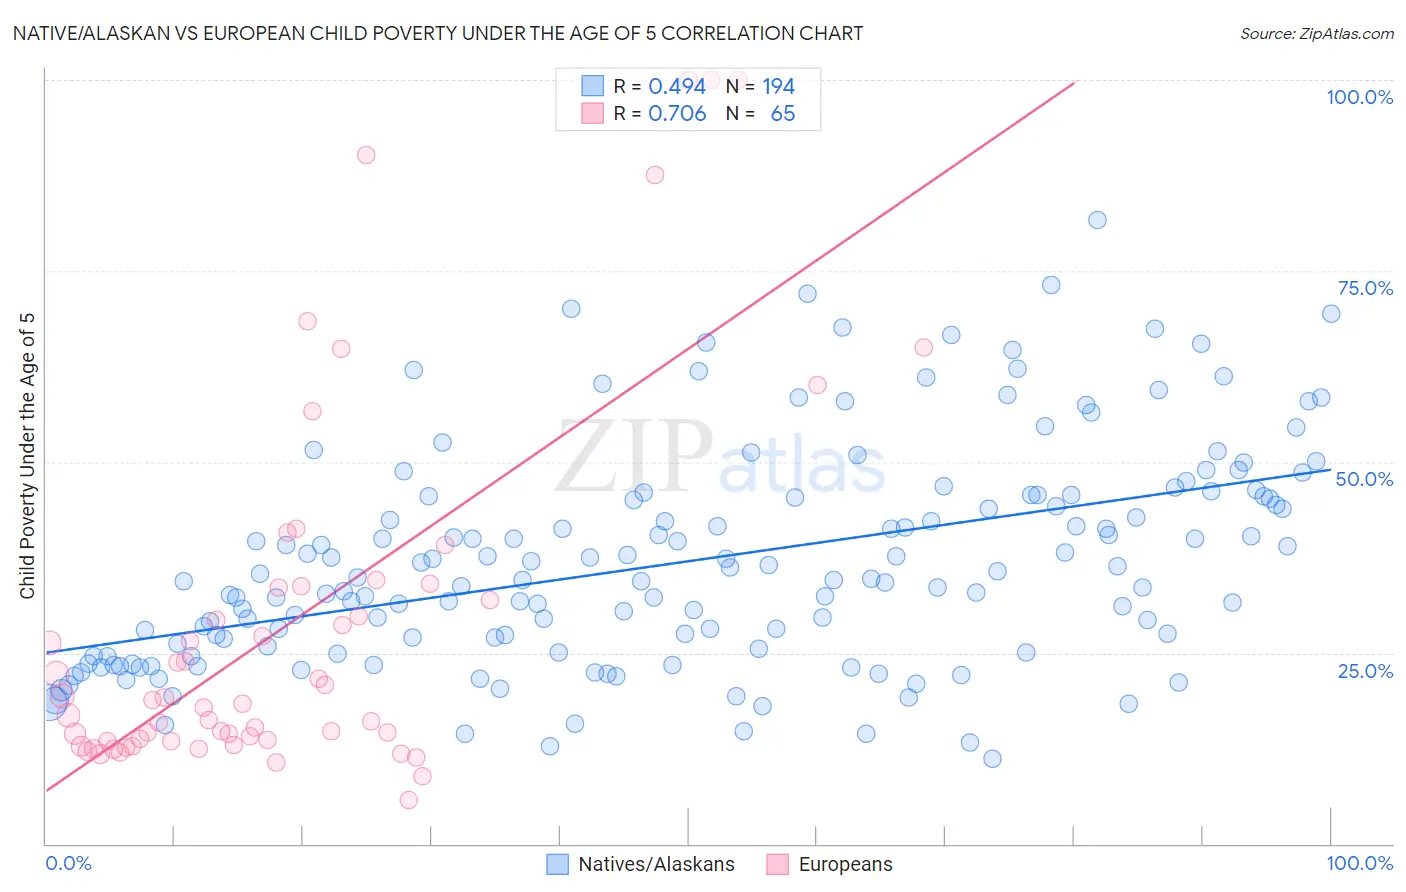
Native/Alaskan vs European Child Poverty Under the Age of 5 Correlation Chart

The statistical analysis conducted on geographies consisting of 489,584,863 people shows a moderate positive correlation between the proportion of Natives/Alaskans and poverty level among children under the age of 5 in the United States with a correlation coefficient (R) of 0.494 and weighted average of 25.6%. Similarly, the statistical analysis conducted on geographies consisting of 523,525,601 people shows a strong positive correlation between the proportion of Europeans and poverty level among children under the age of 5 in the United States with a correlation coefficient (R) of 0.706 and weighted average of 15.9%, a difference of 60.8%.
Native/Alaskan vs European Child Poverty Under the Age of 5

Child Poverty Under the Age of 5 Correlation Summary

MeasurementNative/AlaskanEuropean
Minimum11.1%5.7%
Maximum81.6%100.0%
Range70.5%94.3%
Mean36.9%28.7%
Median34.6%18.3%
Interquartile 25% (IQ1)25.6%13.5%
Interquartile 75% (IQ3)45.5%33.6%
Interquartile Range (IQR)19.9%20.1%
Standard Deviation (Sample)14.2%24.2%
Standard Deviation (Population)14.2%24.0%

Similar Demographics by Child Poverty Under the Age of 5

Demographics Similar to Natives/Alaskans by Child Poverty Under the Age of 5

In terms of child poverty under the age of 5, the demographic groups most similar to Natives/Alaskans are Black/African American (25.7%, a difference of 0.50%), Colville (25.7%, a difference of 0.50%), Apache (25.0%, a difference of 2.2%), Kiowa (24.5%, a difference of 4.5%), and Sioux (26.9%, a difference of 5.4%).
DemographicsRating | RankChild Poverty Under the Age of 5
Central American Indians
0.0
/100
|
#326
Tragic
23.9%
Dominicans
0.0
/100
|
#327
Tragic
24.0%
Immigrants | Dominican Republic
0.0
/100
|
#328
Tragic
24.1%
Cajuns
0.0
/100
|
#329
Tragic
24.1%
Creek
0.0
/100
|
#330
Tragic
24.2%
Kiowa
0.0
/100
|
#331
Tragic
24.5%
Apache
0.0
/100
|
#332
Tragic
25.0%
Natives/Alaskans
0.0
/100
|
#333
Tragic
25.6%
Blacks/African Americans
0.0
/100
|
#334
Tragic
25.7%
Colville
0.0
/100
|
#335
Tragic
25.7%
Sioux
0.0
/100
|
#336
Tragic
26.9%
Pima
0.0
/100
|
#337
Tragic
27.4%
Hopi
0.0
/100
|
#338
Tragic
27.7%
Yup'ik
0.0
/100
|
#339
Tragic
27.7%
Cheyenne
0.0
/100
|
#340
Tragic
28.3%

Demographics Similar to Europeans by Child Poverty Under the Age of 5

In terms of child poverty under the age of 5, the demographic groups most similar to Europeans are Immigrants from North America (15.9%, a difference of 0.21%), Armenian (15.8%, a difference of 0.28%), Immigrants from Spain (15.9%, a difference of 0.28%), Tlingit-Haida (15.9%, a difference of 0.33%), and Immigrants from Zimbabwe (15.8%, a difference of 0.41%).
DemographicsRating | RankChild Poverty Under the Age of 5
Immigrants | Kazakhstan
96.2
/100
|
#96
Exceptional
15.8%
Macedonians
96.2
/100
|
#97
Exceptional
15.8%
Immigrants | South Africa
96.1
/100
|
#98
Exceptional
15.8%
Palestinians
95.9
/100
|
#99
Exceptional
15.8%
Immigrants | Canada
95.9
/100
|
#100
Exceptional
15.8%
Immigrants | Zimbabwe
95.9
/100
|
#101
Exceptional
15.8%
Armenians
95.7
/100
|
#102
Exceptional
15.8%
Europeans
95.3
/100
|
#103
Exceptional
15.9%
Immigrants | North America
94.9
/100
|
#104
Exceptional
15.9%
Immigrants | Spain
94.8
/100
|
#105
Exceptional
15.9%
Tlingit-Haida
94.7
/100
|
#106
Exceptional
15.9%
Slovenes
94.4
/100
|
#107
Exceptional
16.0%
Immigrants | Brazil
94.4
/100
|
#108
Exceptional
16.0%
Northern Europeans
94.3
/100
|
#109
Exceptional
16.0%
Romanians
94.3
/100
|
#110
Exceptional
16.0%