Native Hawaiian vs Central American Indian Single Mother Poverty
COMPARE
Native Hawaiian
Central American Indian
Single Mother Poverty
Single Mother Poverty Comparison
Native Hawaiians
Central American Indians
28.4%
SINGLE MOTHER POVERTY
88.9/ 100
METRIC RATING
136th/ 347
METRIC RANK
34.3%
SINGLE MOTHER POVERTY
0.0/ 100
METRIC RATING
312th/ 347
METRIC RANK
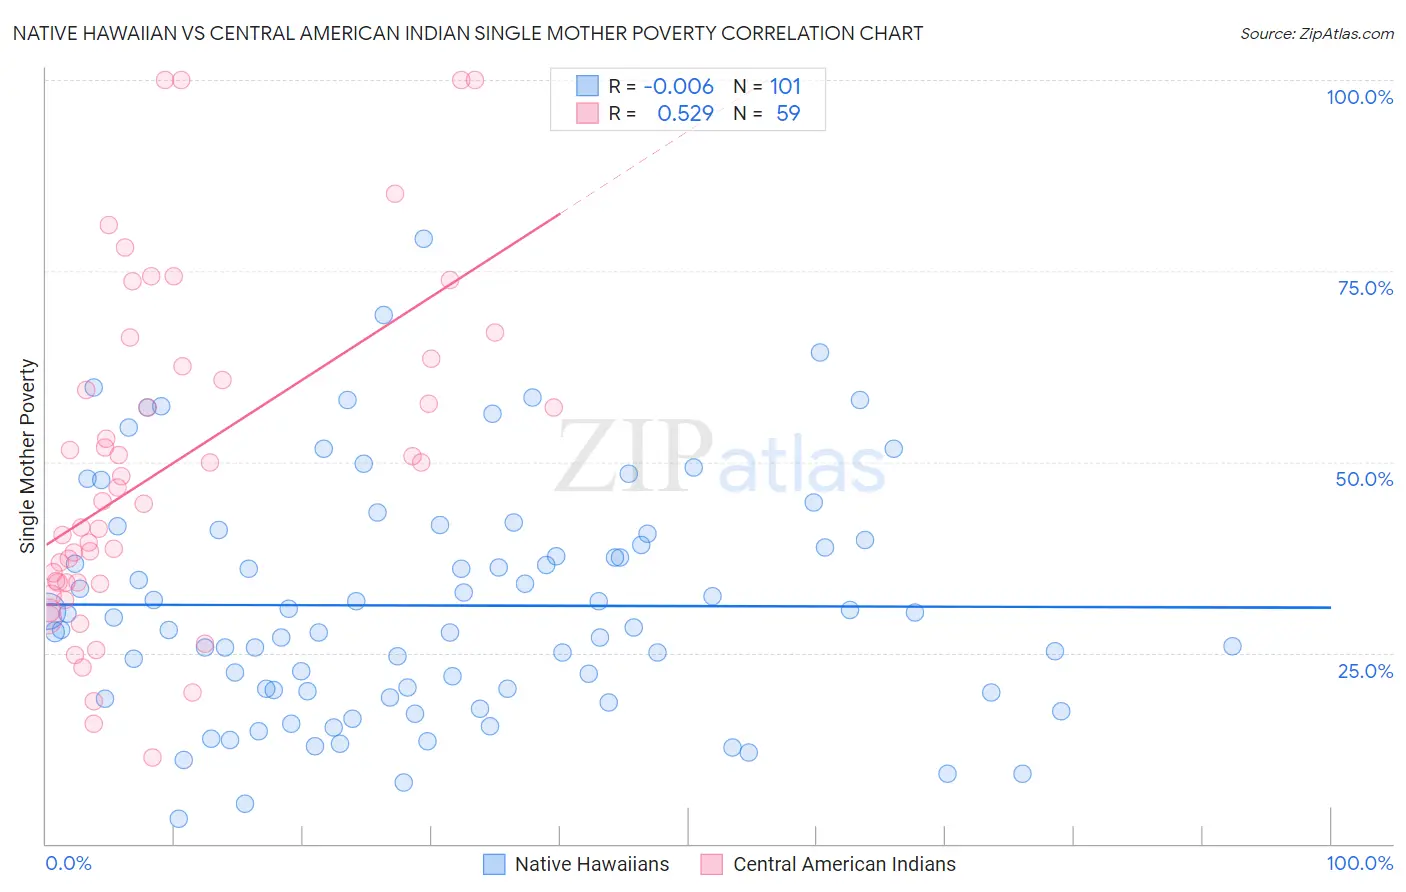
Native Hawaiian vs Central American Indian Single Mother Poverty Correlation Chart
The statistical analysis conducted on geographies consisting of 326,645,581 people shows no correlation between the proportion of Native Hawaiians and poverty level among single mothers in the United States with a correlation coefficient (R) of -0.006 and weighted average of 28.4%. Similarly, the statistical analysis conducted on geographies consisting of 321,816,529 people shows a substantial positive correlation between the proportion of Central American Indians and poverty level among single mothers in the United States with a correlation coefficient (R) of 0.529 and weighted average of 34.3%, a difference of 20.7%.
Single Mother Poverty Correlation Summary
| Measurement | Native Hawaiian | Central American Indian |
| Minimum | 3.3% | 11.3% |
| Maximum | 79.2% | 100.0% |
| Range | 75.9% | 88.7% |
| Mean | 31.2% | 49.3% |
| Median | 28.4% | 44.9% |
| Interquartile 25% (IQ1) | 19.8% | 34.2% |
| Interquartile 75% (IQ3) | 40.2% | 62.6% |
| Interquartile Range (IQR) | 20.4% | 28.3% |
| Standard Deviation (Sample) | 15.3% | 22.0% |
| Standard Deviation (Population) | 15.3% | 21.8% |
Similar Demographics by Single Mother Poverty
Demographics Similar to Native Hawaiians by Single Mother Poverty
In terms of single mother poverty, the demographic groups most similar to Native Hawaiians are Immigrants from Canada (28.4%, a difference of 0.0%), Immigrants from Southern Europe (28.4%, a difference of 0.040%), Immigrants from Spain (28.4%, a difference of 0.040%), Immigrants from Belgium (28.5%, a difference of 0.050%), and Swedish (28.4%, a difference of 0.060%).
| Demographics | Rating | Rank | Single Mother Poverty |
| South Americans | 90.4 /100 | #129 | Exceptional 28.4% |
| Norwegians | 90.4 /100 | #130 | Exceptional 28.4% |
| Immigrants | Austria | 90.3 /100 | #131 | Exceptional 28.4% |
| Immigrants | Morocco | 89.5 /100 | #132 | Excellent 28.4% |
| Swedes | 89.4 /100 | #133 | Excellent 28.4% |
| Immigrants | Southern Europe | 89.2 /100 | #134 | Excellent 28.4% |
| Immigrants | Spain | 89.2 /100 | #135 | Excellent 28.4% |
| Native Hawaiians | 88.9 /100 | #136 | Excellent 28.4% |
| Immigrants | Canada | 88.9 /100 | #137 | Excellent 28.4% |
| Immigrants | Belgium | 88.5 /100 | #138 | Excellent 28.5% |
| Samoans | 88.1 /100 | #139 | Excellent 28.5% |
| Immigrants | Colombia | 88.0 /100 | #140 | Excellent 28.5% |
| Danes | 87.1 /100 | #141 | Excellent 28.5% |
| South Africans | 86.6 /100 | #142 | Excellent 28.5% |
| Immigrants | North America | 86.5 /100 | #143 | Excellent 28.5% |
Demographics Similar to Central American Indians by Single Mother Poverty
In terms of single mother poverty, the demographic groups most similar to Central American Indians are Alsatian (34.3%, a difference of 0.080%), Immigrants from Dominican Republic (34.4%, a difference of 0.080%), Chickasaw (34.4%, a difference of 0.26%), Hopi (34.5%, a difference of 0.34%), and Honduran (34.2%, a difference of 0.39%).
| Demographics | Rating | Rank | Single Mother Poverty |
| Immigrants | Central America | 0.0 /100 | #305 | Tragic 33.6% |
| Immigrants | Congo | 0.0 /100 | #306 | Tragic 33.8% |
| Comanche | 0.0 /100 | #307 | Tragic 33.9% |
| Immigrants | Mexico | 0.0 /100 | #308 | Tragic 34.0% |
| Potawatomi | 0.0 /100 | #309 | Tragic 34.1% |
| Hondurans | 0.0 /100 | #310 | Tragic 34.2% |
| Alsatians | 0.0 /100 | #311 | Tragic 34.3% |
| Central American Indians | 0.0 /100 | #312 | Tragic 34.3% |
| Immigrants | Dominican Republic | 0.0 /100 | #313 | Tragic 34.4% |
| Chickasaw | 0.0 /100 | #314 | Tragic 34.4% |
| Hopi | 0.0 /100 | #315 | Tragic 34.5% |
| Dominicans | 0.0 /100 | #316 | Tragic 34.5% |
| Cherokee | 0.0 /100 | #317 | Tragic 34.5% |
| Immigrants | Honduras | 0.0 /100 | #318 | Tragic 34.7% |
| Chippewa | 0.0 /100 | #319 | Tragic 34.8% |