Mexican vs Luxembourger Child Poverty Among Girls Under 16

COMPARE

Mexican
Race
Ancestry
AfghanAfricanAlaska NativeAlaskan AthabascanAlbanianAleutAlsatianAmericanApacheArabArapahoArgentineanArmenianAssyrian/Chaldean/SyriacAustralianAustrianBahamianBangladeshiBarbadianBasqueBelgianBelizeanBermudanBhutaneseBlackfeetBolivianBrazilianBritishBritish West IndianBulgarianBurmeseCajunCambodianCanadianCape VerdeanCarpatho RusynCelticCentral AmericanCentral American IndianCherokeeCheyenneChickasawChileanChineseChippewaChoctawColombianColvilleComancheCosta RicanCreeCreekCroatianCrowCubanCypriotCzechCzechoslovakianDanishDelawareDominicanDutchDutch West IndianEastern EuropeanEcuadorianEgyptianEnglishEstonianEthiopianEuropeanFijianFilipinoFinnishFrenchFrench American IndianFrench CanadianGermanGerman RussianGhanaianGreekGuamanian/ChamorroGuatemalanGuyaneseHaitianHmongHonduranHopiHoumaHungarianIcelanderIndian (Asian)IndonesianInupiatIranianIraqiIrishIroquoisIsraeliItalianJamaicanJapaneseJordanianKenyanKiowaKoreanLaotianLatvianLebaneseLiberianLithuanianLumbeeMacedonianMalaysianMalteseMarshalleseMenomineeMexicanMexican American IndianMongolianMoroccanNative HawaiianNavajoNepaleseNew ZealanderNicaraguanNigerianNorthern EuropeanNorwegianOkinawanOsageOttawaPaiutePakistaniPalestinianPanamanianParaguayanPennsylvania GermanPeruvianPimaPolishPortuguesePotawatomiPuebloPuerto RicanPuget Sound SalishRomanianRussianSalvadoranSamoanScandinavianScotch-IrishScottishSeminoleSenegaleseSerbianShoshoneSierra LeoneanSiouxSlavicSlovakSloveneSomaliSouth AfricanSouth AmericanSouth American IndianSoviet UnionSpaniardSpanishSpanish AmericanSpanish American IndianSri LankanSubsaharan AfricanSudaneseSwedishSwissSyrianTaiwaneseThaiTlingit-HaidaTohono O'OdhamTonganTrinidadian and TobagonianTsimshianTurkishU.S. Virgin IslanderUgandanUkrainianUruguayanUteVenezuelanVietnameseWelshWest IndianYakamaYaquiYugoslavianYumanYup'ikZimbabwean
Immigration
NonimmigrantsImmigrantsAfghanistanAfricaAlbaniaArgentinaArmeniaAsiaAustraliaAustriaBahamasBangladeshBarbadosBelarusBelgiumBelizeBoliviaBosnia and HerzegovinaBrazilBulgariaBurma/MyanmarCabo VerdeCambodiaCameroonCanadaCaribbeanCentral AmericaChileChinaColombiaCongoCosta RicaCroatiaCubaCzechoslovakiaDenmarkDominicaDominican RepublicEastern AfricaEastern AsiaEastern EuropeEcuadorEgyptEl SalvadorEnglandEritreaEthiopiaEuropeFijiFranceGermanyGhanaGreeceGrenadaGuatemalaGuyanaHaitiHondurasHong KongHungaryIndiaIndonesiaIranIraqIrelandIsraelItalyJamaicaJapanJordanKazakhstanKenyaKoreaKuwaitLaosLatin AmericaLatviaLebanonLiberiaLithuaniaMalaysiaMexicoMicronesiaMiddle AfricaMoldovaMoroccoNepalNetherlandsNicaraguaNigeriaNorth AmericaNorth MacedoniaNorthern AfricaNorthern EuropeNorwayOceaniaPakistanPanamaPeruPhilippinesPolandPortugalRomaniaRussiaSaudi ArabiaScotlandSenegalSerbiaSierra LeoneSingaporeSomaliaSouth AfricaSouth AmericaSouth Central AsiaSouth Eastern AsiaSouthern EuropeSpainSri LankaSt. Vincent and the GrenadinesSudanSwedenSwitzerlandSyriaTaiwanThailandTrinidad and TobagoTurkeyUgandaUkraineUruguayUzbekistanVenezuelaVietnamWest IndiesWestern AfricaWestern AsiaWestern EuropeYemenZaireZimbabweAzores
Luxembourger
Race
Ancestry
AfghanAfricanAlaska NativeAlaskan AthabascanAlbanianAleutAlsatianAmericanApacheArabArapahoArgentineanArmenianAssyrian/Chaldean/SyriacAustralianAustrianBahamianBangladeshiBarbadianBasqueBelgianBelizeanBermudanBhutaneseBlackfeetBolivianBrazilianBritishBritish West IndianBulgarianBurmeseCajunCambodianCanadianCape VerdeanCarpatho RusynCelticCentral AmericanCentral American IndianCherokeeCheyenneChickasawChileanChineseChippewaChoctawColombianColvilleComancheCosta RicanCreeCreekCroatianCrowCubanCypriotCzechCzechoslovakianDanishDelawareDominicanDutchDutch West IndianEastern EuropeanEcuadorianEgyptianEnglishEstonianEthiopianEuropeanFijianFilipinoFinnishFrenchFrench American IndianFrench CanadianGermanGerman RussianGhanaianGreekGuamanian/ChamorroGuatemalanGuyaneseHaitianHmongHonduranHopiHoumaHungarianIcelanderIndian (Asian)IndonesianInupiatIranianIraqiIrishIroquoisIsraeliItalianJamaicanJapaneseJordanianKenyanKiowaKoreanLaotianLatvianLebaneseLiberianLithuanianLumbeeLuxembourgerMacedonianMalaysianMalteseMarshalleseMenomineeMexican American IndianMongolianMoroccanNative HawaiianNavajoNepaleseNew ZealanderNicaraguanNigerianNorthern EuropeanNorwegianOkinawanOsageOttawaPaiutePakistaniPalestinianPanamanianParaguayanPennsylvania GermanPeruvianPimaPolishPortuguesePotawatomiPuebloPuerto RicanPuget Sound SalishRomanianRussianSalvadoranSamoanScandinavianScotch-IrishScottishSeminoleSenegaleseSerbianShoshoneSierra LeoneanSiouxSlavicSlovakSloveneSomaliSouth AfricanSouth AmericanSouth American IndianSoviet UnionSpaniardSpanishSpanish AmericanSpanish American IndianSri LankanSubsaharan AfricanSudaneseSwedishSwissSyrianTaiwaneseThaiTlingit-HaidaTohono O'OdhamTonganTrinidadian and TobagonianTsimshianTurkishU.S. Virgin IslanderUgandanUkrainianUruguayanUteVenezuelanVietnameseWelshWest IndianYakamaYaquiYugoslavianYumanYup'ikZimbabwean
Immigration
NonimmigrantsImmigrantsAfghanistanAfricaAlbaniaArgentinaArmeniaAsiaAustraliaAustriaBahamasBangladeshBarbadosBelarusBelgiumBelizeBoliviaBosnia and HerzegovinaBrazilBulgariaBurma/MyanmarCabo VerdeCambodiaCameroonCanadaCaribbeanCentral AmericaChileChinaColombiaCongoCosta RicaCroatiaCubaCzechoslovakiaDenmarkDominicaDominican RepublicEastern AfricaEastern AsiaEastern EuropeEcuadorEgyptEl SalvadorEnglandEritreaEthiopiaEuropeFijiFranceGermanyGhanaGreeceGrenadaGuatemalaGuyanaHaitiHondurasHong KongHungaryIndiaIndonesiaIranIraqIrelandIsraelItalyJamaicaJapanJordanKazakhstanKenyaKoreaKuwaitLaosLatin AmericaLatviaLebanonLiberiaLithuaniaMalaysiaMexicoMicronesiaMiddle AfricaMoldovaMoroccoNepalNetherlandsNicaraguaNigeriaNorth AmericaNorth MacedoniaNorthern AfricaNorthern EuropeNorwayOceaniaPakistanPanamaPeruPhilippinesPolandPortugalRomaniaRussiaSaudi ArabiaScotlandSenegalSerbiaSierra LeoneSingaporeSomaliaSouth AfricaSouth AmericaSouth Central AsiaSouth Eastern AsiaSouthern EuropeSpainSri LankaSt. Vincent and the GrenadinesSudanSwedenSwitzerlandSyriaTaiwanThailandTrinidad and TobagoTurkeyUgandaUkraineUruguayUzbekistanVenezuelaVietnamWest IndiesWestern AfricaWestern AsiaWestern EuropeYemenZaireZimbabweAzores
Child Poverty Among Girls Under 16
Income
Poverty
Unemployment
Labor Participation
Family Structure
Vehicle Availability
Education Level
Disability

Child Poverty Among Girls Under 16 Comparison

Mexicans

Luxembourgers

Tragic
Exceptional
20.9%
CHILD POVERTY AMONG GIRLS UNDER 16
0.0/ 100
METRIC RATING
298th/ 347
METRIC RANK
14.3%
CHILD POVERTY AMONG GIRLS UNDER 16
99.0/ 100
METRIC RATING
53rd/ 347
METRIC RANK

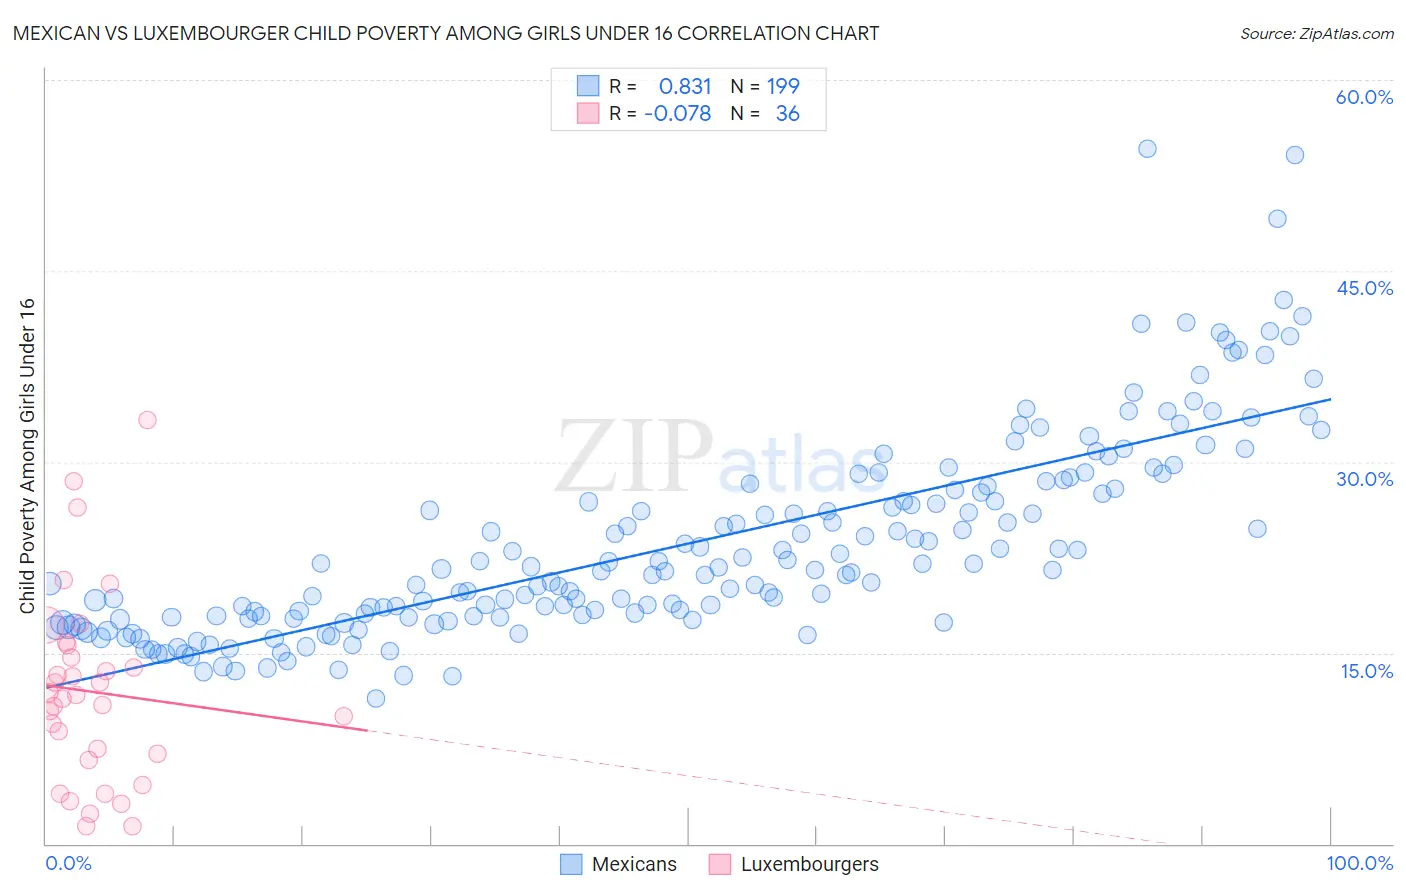
Mexican vs Luxembourger Child Poverty Among Girls Under 16 Correlation Chart

The statistical analysis conducted on geographies consisting of 545,930,969 people shows a very strong positive correlation between the proportion of Mexicans and poverty level among girls under the age of 16 in the United States with a correlation coefficient (R) of 0.831 and weighted average of 20.9%. Similarly, the statistical analysis conducted on geographies consisting of 142,903,603 people shows a slight negative correlation between the proportion of Luxembourgers and poverty level among girls under the age of 16 in the United States with a correlation coefficient (R) of -0.078 and weighted average of 14.3%, a difference of 46.2%.
Mexican vs Luxembourger Child Poverty Among Girls Under 16

Child Poverty Among Girls Under 16 Correlation Summary

MeasurementMexicanLuxembourger
Minimum11.4%1.4%
Maximum54.6%33.3%
Range43.2%32.0%
Mean23.5%11.9%
Median21.5%11.6%
Interquartile 25% (IQ1)17.8%6.9%
Interquartile 75% (IQ3)27.8%15.2%
Interquartile Range (IQR)10.0%8.3%
Standard Deviation (Sample)7.9%7.4%
Standard Deviation (Population)7.8%7.3%

Similar Demographics by Child Poverty Among Girls Under 16

Demographics Similar to Mexicans by Child Poverty Among Girls Under 16

In terms of child poverty among girls under 16, the demographic groups most similar to Mexicans are Hispanic or Latino (21.0%, a difference of 0.40%), Inupiat (20.8%, a difference of 0.52%), Immigrants from West Indies (20.7%, a difference of 0.59%), Somali (21.0%, a difference of 0.72%), and Immigrants from Caribbean (20.7%, a difference of 0.87%).
DemographicsRating | RankChild Poverty Among Girls Under 16
Chippewa
0.0
/100
|
#291
Tragic
20.6%
Immigrants | Latin America
0.0
/100
|
#292
Tragic
20.6%
Immigrants | Grenada
0.0
/100
|
#293
Tragic
20.7%
Immigrants | Senegal
0.0
/100
|
#294
Tragic
20.7%
Immigrants | Caribbean
0.0
/100
|
#295
Tragic
20.7%
Immigrants | West Indies
0.0
/100
|
#296
Tragic
20.7%
Inupiat
0.0
/100
|
#297
Tragic
20.8%
Mexicans
0.0
/100
|
#298
Tragic
20.9%
Hispanics or Latinos
0.0
/100
|
#299
Tragic
21.0%
Somalis
0.0
/100
|
#300
Tragic
21.0%
Choctaw
0.0
/100
|
#301
Tragic
21.1%
Seminole
0.0
/100
|
#302
Tragic
21.2%
British West Indians
0.0
/100
|
#303
Tragic
21.3%
Indonesians
0.0
/100
|
#304
Tragic
21.3%
Guatemalans
0.0
/100
|
#305
Tragic
21.4%

Demographics Similar to Luxembourgers by Child Poverty Among Girls Under 16

In terms of child poverty among girls under 16, the demographic groups most similar to Luxembourgers are Italian (14.3%, a difference of 0.070%), Immigrants from Pakistan (14.2%, a difference of 0.21%), Estonian (14.3%, a difference of 0.43%), Immigrants from Romania (14.3%, a difference of 0.47%), and Immigrants from Indonesia (14.4%, a difference of 0.54%).
DemographicsRating | RankChild Poverty Among Girls Under 16
Croatians
99.3
/100
|
#46
Exceptional
14.1%
Immigrants | Czechoslovakia
99.3
/100
|
#47
Exceptional
14.2%
Czechs
99.3
/100
|
#48
Exceptional
14.2%
Greeks
99.2
/100
|
#49
Exceptional
14.2%
Immigrants | Israel
99.2
/100
|
#50
Exceptional
14.2%
Immigrants | Pakistan
99.1
/100
|
#51
Exceptional
14.2%
Italians
99.1
/100
|
#52
Exceptional
14.3%
Luxembourgers
99.0
/100
|
#53
Exceptional
14.3%
Estonians
98.9
/100
|
#54
Exceptional
14.3%
Immigrants | Romania
98.9
/100
|
#55
Exceptional
14.3%
Immigrants | Indonesia
98.9
/100
|
#56
Exceptional
14.4%
Immigrants | Serbia
98.9
/100
|
#57
Exceptional
14.4%
Immigrants | Bulgaria
98.8
/100
|
#58
Exceptional
14.4%
Zimbabweans
98.8
/100
|
#59
Exceptional
14.4%
Poles
98.7
/100
|
#60
Exceptional
14.4%