Marshallese vs Immigrants from Eritrea Female Poverty Among 25-34 Year Olds

COMPARE

Marshallese
Race
Ancestry
AfghanAfricanAlaska NativeAlaskan AthabascanAlbanianAleutAlsatianAmericanApacheArabArapahoArgentineanArmenianAssyrian/Chaldean/SyriacAustralianAustrianBahamianBangladeshiBarbadianBasqueBelgianBelizeanBermudanBhutaneseBlackfeetBolivianBrazilianBritishBritish West IndianBulgarianBurmeseCajunCambodianCanadianCape VerdeanCarpatho RusynCelticCentral AmericanCentral American IndianCherokeeCheyenneChickasawChileanChineseChippewaChoctawColombianColvilleComancheCosta RicanCreeCreekCroatianCrowCubanCypriotCzechCzechoslovakianDanishDelawareDominicanDutchDutch West IndianEastern EuropeanEcuadorianEgyptianEnglishEstonianEthiopianEuropeanFijianFilipinoFinnishFrenchFrench American IndianFrench CanadianGermanGerman RussianGhanaianGreekGuamanian/ChamorroGuatemalanGuyaneseHaitianHmongHonduranHopiHoumaHungarianIcelanderIndian (Asian)IndonesianInupiatIranianIraqiIrishIroquoisIsraeliItalianJamaicanJapaneseJordanianKenyanKiowaKoreanLaotianLatvianLebaneseLiberianLithuanianLumbeeLuxembourgerMacedonianMalaysianMalteseMarshalleseMenomineeMexicanMexican American IndianMongolianMoroccanNative HawaiianNavajoNepaleseNew ZealanderNicaraguanNigerianNorthern EuropeanNorwegianOkinawanOsageOttawaPaiutePakistaniPalestinianPanamanianParaguayanPennsylvania GermanPeruvianPimaPolishPortuguesePotawatomiPuebloPuerto RicanPuget Sound SalishRomanianRussianSalvadoranSamoanScandinavianScotch-IrishScottishSeminoleSenegaleseSerbianShoshoneSierra LeoneanSiouxSlavicSlovakSloveneSomaliSouth AfricanSouth AmericanSouth American IndianSoviet UnionSpaniardSpanishSpanish AmericanSpanish American IndianSri LankanSubsaharan AfricanSudaneseSwedishSwissSyrianTaiwaneseThaiTlingit-HaidaTohono O'OdhamTonganTrinidadian and TobagonianTsimshianTurkishU.S. Virgin IslanderUgandanUkrainianUruguayanUteVenezuelanVietnameseWelshWest IndianYakamaYaquiYugoslavianYumanYup'ikZimbabwean
Immigration
NonimmigrantsImmigrantsAfghanistanAfricaAlbaniaArgentinaArmeniaAsiaAustraliaAustriaBahamasBangladeshBarbadosBelarusBelgiumBelizeBoliviaBosnia and HerzegovinaBrazilBulgariaBurma/MyanmarCabo VerdeCambodiaCameroonCanadaCaribbeanCentral AmericaChileChinaColombiaCongoCosta RicaCroatiaCubaCzechoslovakiaDenmarkDominicaDominican RepublicEastern AfricaEastern AsiaEastern EuropeEcuadorEgyptEl SalvadorEnglandEthiopiaEuropeFijiFranceGermanyGhanaGreeceGrenadaGuatemalaGuyanaHaitiHondurasHong KongHungaryIndiaIndonesiaIranIraqIrelandIsraelItalyJamaicaJapanJordanKazakhstanKenyaKoreaKuwaitLaosLatin AmericaLatviaLebanonLiberiaLithuaniaMalaysiaMexicoMicronesiaMiddle AfricaMoldovaMoroccoNepalNetherlandsNicaraguaNigeriaNorth AmericaNorth MacedoniaNorthern AfricaNorthern EuropeNorwayOceaniaPakistanPanamaPeruPhilippinesPolandPortugalRomaniaRussiaSaudi ArabiaScotlandSenegalSerbiaSierra LeoneSingaporeSomaliaSouth AfricaSouth AmericaSouth Central AsiaSouth Eastern AsiaSouthern EuropeSpainSri LankaSt. Vincent and the GrenadinesSudanSwedenSwitzerlandSyriaTaiwanThailandTrinidad and TobagoTurkeyUgandaUkraineUruguayUzbekistanVenezuelaVietnamWest IndiesWestern AfricaWestern AsiaWestern EuropeYemenZaireZimbabweAzores
Immigrants from Eritrea
Race
Ancestry
AfghanAfricanAlaska NativeAlaskan AthabascanAlbanianAleutAlsatianAmericanApacheArabArapahoArgentineanArmenianAssyrian/Chaldean/SyriacAustralianAustrianBahamianBangladeshiBarbadianBasqueBelgianBelizeanBermudanBhutaneseBlackfeetBolivianBrazilianBritishBritish West IndianBulgarianBurmeseCajunCambodianCanadianCape VerdeanCarpatho RusynCelticCentral AmericanCentral American IndianCherokeeCheyenneChickasawChileanChineseChippewaChoctawColombianColvilleComancheCosta RicanCreeCreekCroatianCrowCubanCypriotCzechCzechoslovakianDanishDelawareDominicanDutchDutch West IndianEastern EuropeanEcuadorianEgyptianEnglishEstonianEthiopianEuropeanFijianFilipinoFinnishFrenchFrench American IndianFrench CanadianGermanGerman RussianGhanaianGreekGuamanian/ChamorroGuatemalanGuyaneseHaitianHmongHonduranHopiHoumaHungarianIcelanderIndian (Asian)IndonesianInupiatIranianIraqiIrishIroquoisIsraeliItalianJamaicanJapaneseJordanianKenyanKiowaKoreanLaotianLatvianLebaneseLiberianLithuanianLumbeeLuxembourgerMacedonianMalaysianMalteseMenomineeMexicanMexican American IndianMongolianMoroccanNative HawaiianNavajoNepaleseNew ZealanderNicaraguanNigerianNorthern EuropeanNorwegianOkinawanOsageOttawaPaiutePakistaniPalestinianPanamanianParaguayanPennsylvania GermanPeruvianPimaPolishPortuguesePotawatomiPuebloPuerto RicanPuget Sound SalishRomanianRussianSalvadoranSamoanScandinavianScotch-IrishScottishSeminoleSenegaleseSerbianShoshoneSierra LeoneanSiouxSlavicSlovakSloveneSomaliSouth AfricanSouth AmericanSouth American IndianSoviet UnionSpaniardSpanishSpanish AmericanSpanish American IndianSri LankanSubsaharan AfricanSudaneseSwedishSwissSyrianTaiwaneseThaiTlingit-HaidaTohono O'OdhamTonganTrinidadian and TobagonianTsimshianTurkishU.S. Virgin IslanderUgandanUkrainianUruguayanUteVenezuelanVietnameseWelshWest IndianYakamaYaquiYugoslavianYumanYup'ikZimbabwean
Immigration
NonimmigrantsImmigrantsAfghanistanAfricaAlbaniaArgentinaArmeniaAsiaAustraliaAustriaBahamasBangladeshBarbadosBelarusBelgiumBelizeBoliviaBosnia and HerzegovinaBrazilBulgariaBurma/MyanmarCabo VerdeCambodiaCameroonCanadaCaribbeanCentral AmericaChileChinaColombiaCongoCosta RicaCroatiaCubaCzechoslovakiaDenmarkDominicaDominican RepublicEastern AfricaEastern AsiaEastern EuropeEcuadorEgyptEl SalvadorEnglandEritreaEthiopiaEuropeFijiFranceGermanyGhanaGreeceGrenadaGuatemalaGuyanaHaitiHondurasHong KongHungaryIndiaIndonesiaIranIraqIrelandIsraelItalyJamaicaJapanJordanKazakhstanKenyaKoreaKuwaitLaosLatin AmericaLatviaLebanonLiberiaLithuaniaMalaysiaMexicoMicronesiaMiddle AfricaMoldovaMoroccoNepalNetherlandsNicaraguaNigeriaNorth AmericaNorth MacedoniaNorthern AfricaNorthern EuropeNorwayOceaniaPakistanPanamaPeruPhilippinesPolandPortugalRomaniaRussiaSaudi ArabiaScotlandSenegalSerbiaSierra LeoneSingaporeSomaliaSouth AfricaSouth AmericaSouth Central AsiaSouth Eastern AsiaSouthern EuropeSpainSri LankaSt. Vincent and the GrenadinesSudanSwedenSwitzerlandSyriaTaiwanThailandTrinidad and TobagoTurkeyUgandaUkraineUruguayUzbekistanVenezuelaVietnamWest IndiesWestern AfricaWestern AsiaWestern EuropeYemenZaireZimbabweAzores
Female Poverty Among 25-34 Year Olds
Income
Poverty
Unemployment
Labor Participation
Family Structure
Vehicle Availability
Education Level
Disability

Female Poverty Among 25-34 Year Olds Comparison

Marshallese

Immigrants from Eritrea

Tragic
Fair
15.3%
FEMALE POVERTY AMONG 25-34 YEAR OLDS
0.2/ 100
METRIC RATING
260th/ 347
METRIC RANK
13.7%
FEMALE POVERTY AMONG 25-34 YEAR OLDS
32.7/ 100
METRIC RATING
188th/ 347
METRIC RANK

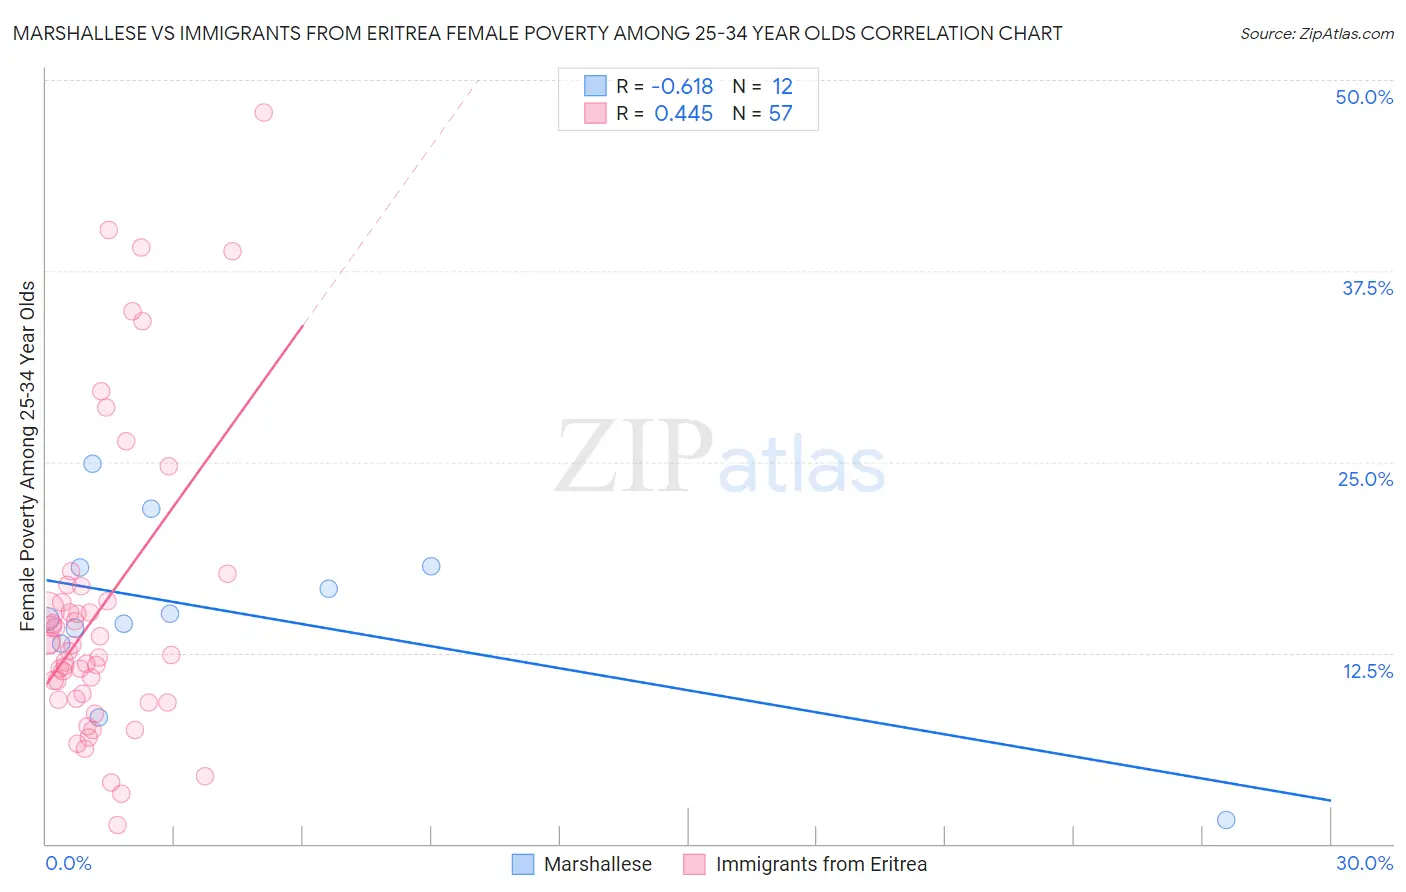
Marshallese vs Immigrants from Eritrea Female Poverty Among 25-34 Year Olds Correlation Chart

The statistical analysis conducted on geographies consisting of 14,731,838 people shows a significant negative correlation between the proportion of Marshallese and poverty level among females between the ages 25 and 34 in the United States with a correlation coefficient (R) of -0.618 and weighted average of 15.3%. Similarly, the statistical analysis conducted on geographies consisting of 104,678,309 people shows a moderate positive correlation between the proportion of Immigrants from Eritrea and poverty level among females between the ages 25 and 34 in the United States with a correlation coefficient (R) of 0.445 and weighted average of 13.7%, a difference of 11.2%.
Marshallese vs Immigrants from Eritrea Female Poverty Among 25-34 Year Olds

Female Poverty Among 25-34 Year Olds Correlation Summary

MeasurementMarshalleseImmigrants from Eritrea
Minimum1.5%1.2%
Maximum24.8%47.9%
Range23.3%46.6%
Mean15.1%15.4%
Median14.9%12.6%
Interquartile 25% (IQ1)13.6%9.5%
Interquartile 75% (IQ3)18.1%16.4%
Interquartile Range (IQR)4.5%6.9%
Standard Deviation (Sample)6.0%10.0%
Standard Deviation (Population)5.8%9.9%

Similar Demographics by Female Poverty Among 25-34 Year Olds

Demographics Similar to Marshallese by Female Poverty Among 25-34 Year Olds

In terms of female poverty among 25-34 year olds, the demographic groups most similar to Marshallese are Liberian (15.3%, a difference of 0.22%), Immigrants from Belize (15.3%, a difference of 0.26%), Immigrants from Cuba (15.2%, a difference of 0.37%), Nepalese (15.2%, a difference of 0.39%), and Mexican American Indian (15.4%, a difference of 0.50%).
DemographicsRating | RankFemale Poverty Among 25-34 Year Olds
Immigrants | West Indies
0.4
/100
|
#253
Tragic
15.1%
Somalis
0.4
/100
|
#254
Tragic
15.1%
Immigrants | Laos
0.3
/100
|
#255
Tragic
15.2%
West Indians
0.3
/100
|
#256
Tragic
15.2%
Immigrants | Burma/Myanmar
0.3
/100
|
#257
Tragic
15.2%
Nepalese
0.2
/100
|
#258
Tragic
15.2%
Immigrants | Cuba
0.2
/100
|
#259
Tragic
15.2%
Marshallese
0.2
/100
|
#260
Tragic
15.3%
Liberians
0.2
/100
|
#261
Tragic
15.3%
Immigrants | Belize
0.2
/100
|
#262
Tragic
15.3%
Mexican American Indians
0.2
/100
|
#263
Tragic
15.4%
Pennsylvania Germans
0.1
/100
|
#264
Tragic
15.4%
Immigrants | Liberia
0.1
/100
|
#265
Tragic
15.4%
Immigrants | Somalia
0.1
/100
|
#266
Tragic
15.4%
Central Americans
0.1
/100
|
#267
Tragic
15.5%

Demographics Similar to Immigrants from Eritrea by Female Poverty Among 25-34 Year Olds

In terms of female poverty among 25-34 year olds, the demographic groups most similar to Immigrants from Eritrea are Finnish (13.7%, a difference of 0.020%), Immigrants from Uruguay (13.7%, a difference of 0.13%), Slovak (13.7%, a difference of 0.13%), Irish (13.7%, a difference of 0.24%), and Dutch (13.8%, a difference of 0.28%).
DemographicsRating | RankFemale Poverty Among 25-34 Year Olds
Guamanians/Chamorros
41.5
/100
|
#181
Average
13.6%
Immigrants | Venezuela
40.7
/100
|
#182
Average
13.6%
Portuguese
40.3
/100
|
#183
Average
13.6%
Czechoslovakians
36.8
/100
|
#184
Fair
13.7%
Irish
35.3
/100
|
#185
Fair
13.7%
Immigrants | Uruguay
34.1
/100
|
#186
Fair
13.7%
Slovaks
34.1
/100
|
#187
Fair
13.7%
Immigrants | Eritrea
32.7
/100
|
#188
Fair
13.7%
Finns
32.5
/100
|
#189
Fair
13.7%
Dutch
29.7
/100
|
#190
Fair
13.8%
Immigrants | St. Vincent and the Grenadines
29.3
/100
|
#191
Fair
13.8%
Tlingit-Haida
28.1
/100
|
#192
Fair
13.8%
Immigrants | Kenya
28.0
/100
|
#193
Fair
13.8%
Moroccans
25.1
/100
|
#194
Fair
13.8%
Immigrants | Cambodia
24.0
/100
|
#195
Fair
13.9%