Malaysian vs Jamaican Poverty
COMPARE
Malaysian
Jamaican
Poverty
Poverty Comparison
Malaysians
Jamaicans
13.1%
POVERTY
6.1/ 100
METRIC RATING
209th/ 347
METRIC RANK
14.4%
POVERTY
0.1/ 100
METRIC RATING
263rd/ 347
METRIC RANK
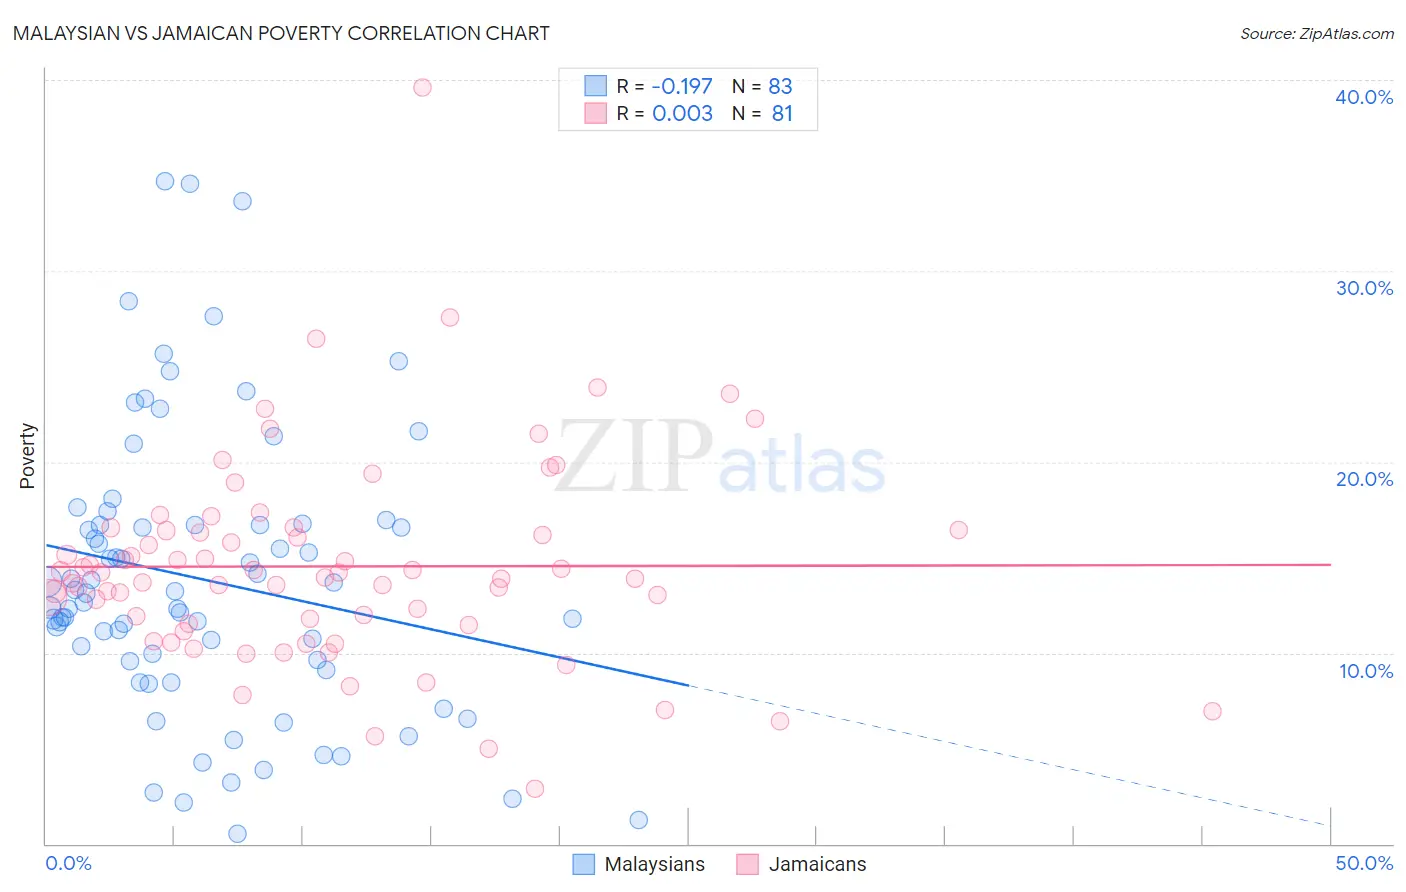
Malaysian vs Jamaican Poverty Correlation Chart
The statistical analysis conducted on geographies consisting of 226,011,043 people shows a poor negative correlation between the proportion of Malaysians and poverty level in the United States with a correlation coefficient (R) of -0.197 and weighted average of 13.1%. Similarly, the statistical analysis conducted on geographies consisting of 367,709,935 people shows no correlation between the proportion of Jamaicans and poverty level in the United States with a correlation coefficient (R) of 0.003 and weighted average of 14.4%, a difference of 9.9%.
Poverty Correlation Summary
| Measurement | Malaysian | Jamaican |
| Minimum | 0.56% | 2.9% |
| Maximum | 34.7% | 39.6% |
| Range | 34.2% | 36.7% |
| Mean | 13.8% | 14.5% |
| Median | 13.1% | 13.9% |
| Interquartile 25% (IQ1) | 9.6% | 11.5% |
| Interquartile 75% (IQ3) | 16.7% | 16.4% |
| Interquartile Range (IQR) | 7.1% | 4.9% |
| Standard Deviation (Sample) | 7.4% | 5.4% |
| Standard Deviation (Population) | 7.4% | 5.4% |
Similar Demographics by Poverty
Demographics Similar to Malaysians by Poverty
In terms of poverty, the demographic groups most similar to Malaysians are Ugandan (13.1%, a difference of 0.030%), Immigrants from the Azores (13.1%, a difference of 0.030%), Panamanian (13.1%, a difference of 0.18%), Immigrants from Eastern Africa (13.1%, a difference of 0.30%), and Moroccan (13.2%, a difference of 0.38%).
| Demographics | Rating | Rank | Poverty |
| Immigrants | Uruguay | 15.6 /100 | #202 | Poor 12.8% |
| Hmong | 15.0 /100 | #203 | Poor 12.8% |
| Immigrants | Western Asia | 14.1 /100 | #204 | Poor 12.9% |
| Tsimshian | 9.2 /100 | #205 | Tragic 13.0% |
| Immigrants | Eastern Africa | 7.0 /100 | #206 | Tragic 13.1% |
| Panamanians | 6.6 /100 | #207 | Tragic 13.1% |
| Ugandans | 6.2 /100 | #208 | Tragic 13.1% |
| Malaysians | 6.1 /100 | #209 | Tragic 13.1% |
| Immigrants | Azores | 6.1 /100 | #210 | Tragic 13.1% |
| Moroccans | 5.2 /100 | #211 | Tragic 13.2% |
| Immigrants | Immigrants | 4.3 /100 | #212 | Tragic 13.2% |
| Immigrants | Panama | 4.1 /100 | #213 | Tragic 13.3% |
| Bermudans | 3.7 /100 | #214 | Tragic 13.3% |
| Japanese | 3.3 /100 | #215 | Tragic 13.3% |
| Immigrants | Nonimmigrants | 3.3 /100 | #216 | Tragic 13.3% |
Demographics Similar to Jamaicans by Poverty
In terms of poverty, the demographic groups most similar to Jamaicans are Immigrants from Jamaica (14.4%, a difference of 0.090%), Immigrants from Guyana (14.5%, a difference of 0.21%), Immigrants from Liberia (14.4%, a difference of 0.35%), Guyanese (14.5%, a difference of 0.38%), and Cherokee (14.4%, a difference of 0.51%).
| Demographics | Rating | Rank | Poverty |
| Mexican American Indians | 0.1 /100 | #256 | Tragic 14.3% |
| Trinidadians and Tobagonians | 0.1 /100 | #257 | Tragic 14.3% |
| Ottawa | 0.1 /100 | #258 | Tragic 14.3% |
| Immigrants | Nicaragua | 0.1 /100 | #259 | Tragic 14.3% |
| Cape Verdeans | 0.1 /100 | #260 | Tragic 14.4% |
| Cherokee | 0.1 /100 | #261 | Tragic 14.4% |
| Immigrants | Liberia | 0.1 /100 | #262 | Tragic 14.4% |
| Jamaicans | 0.1 /100 | #263 | Tragic 14.4% |
| Immigrants | Jamaica | 0.1 /100 | #264 | Tragic 14.4% |
| Immigrants | Guyana | 0.1 /100 | #265 | Tragic 14.5% |
| Guyanese | 0.1 /100 | #266 | Tragic 14.5% |
| Iroquois | 0.1 /100 | #267 | Tragic 14.5% |
| Sub-Saharan Africans | 0.1 /100 | #268 | Tragic 14.5% |
| Immigrants | Cuba | 0.1 /100 | #269 | Tragic 14.6% |
| Central Americans | 0.1 /100 | #270 | Tragic 14.6% |